At Satelligence, we just operationalised our inundation frequency service. We now map inundation for large areas all around the world. Efforts like ESA’s EO4SD (Earth Observation for Sustainable Development) are a great driver to connect to users and get meaningful feedback.
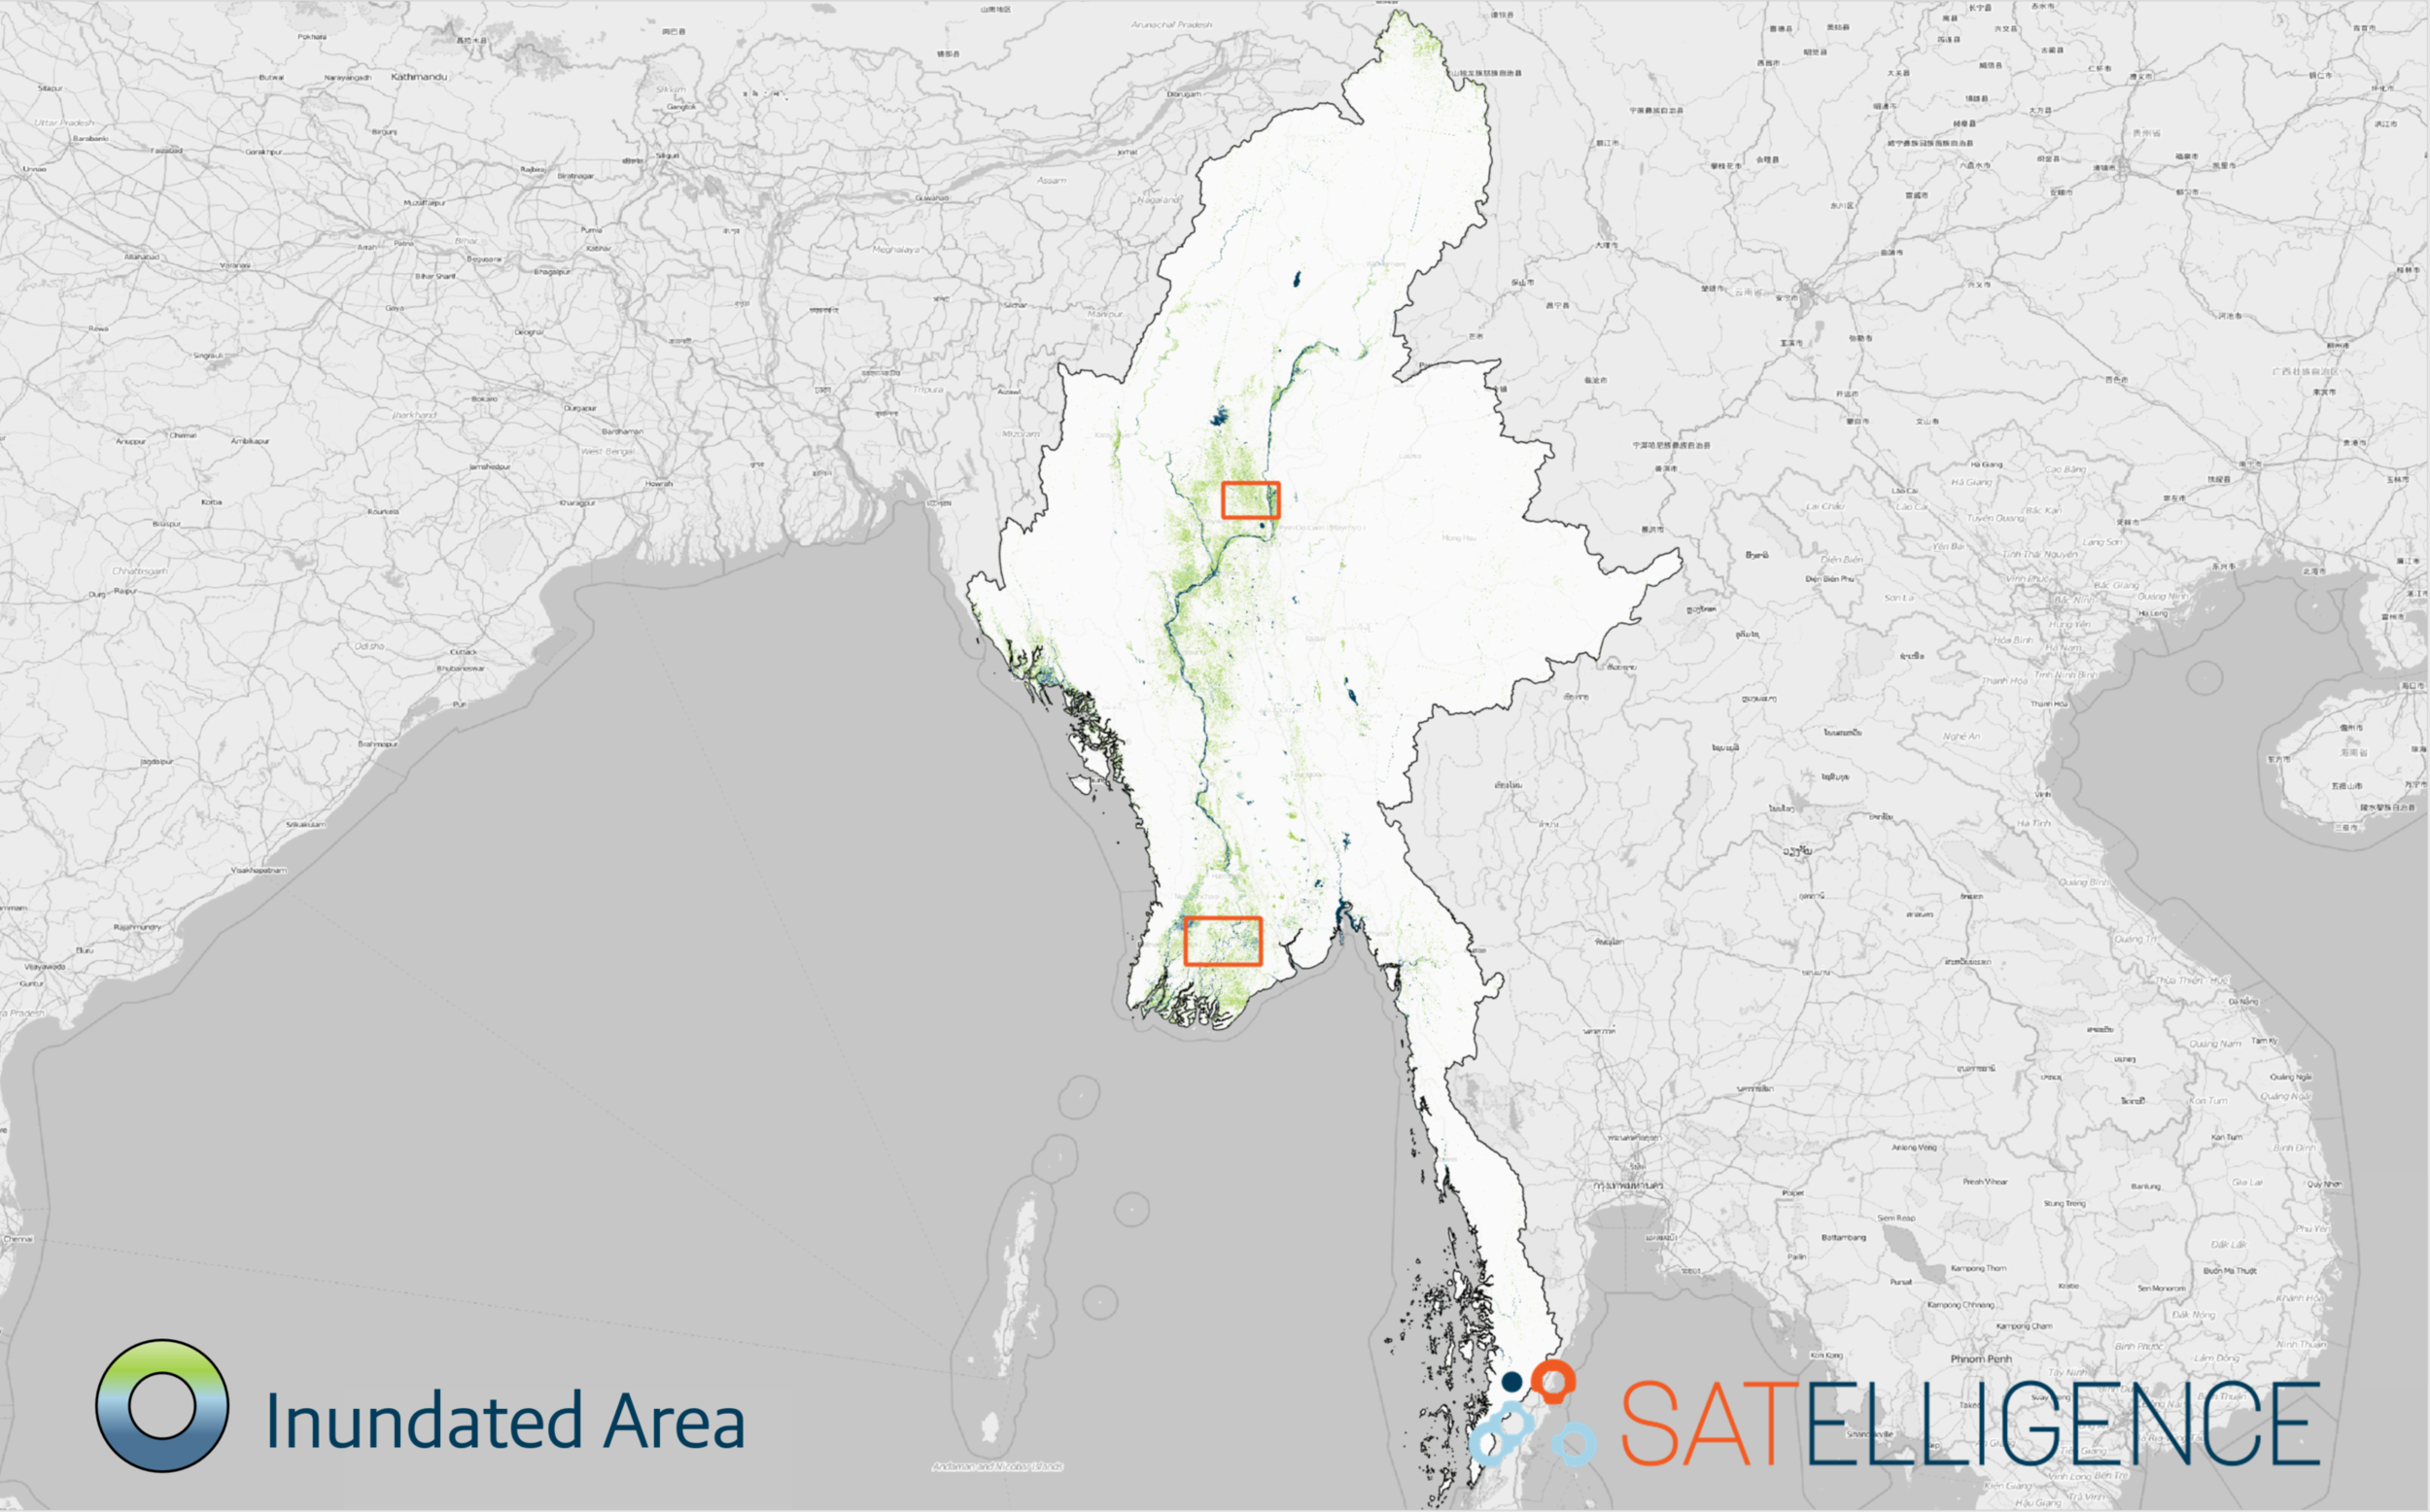
For Myanmar specifically, Satelligence processed ~1200 Sentinel1 images (2017) to detect inundation frequency. Frequently dealing with damaging floods, this inundation map can help identify flood prone areas. Moreover, the map clearly identifies location and size of irrigated rice areas. It offers opportunities to understand why areas are more or less productive in terms of e.g. cropping intensities. Definitely lots to explore with these amounts of data!
Satelligence collaborates with our local partner ImpactTerra to include information about cropping calendars in the service. The map is updated several times per year to provide timely information during the cropping season. That is how Satelligence creates actionable information to help improve farmers’ livelihoods.
This overview map highlights the Irrawaddy river pattern and other permanent water bodies:

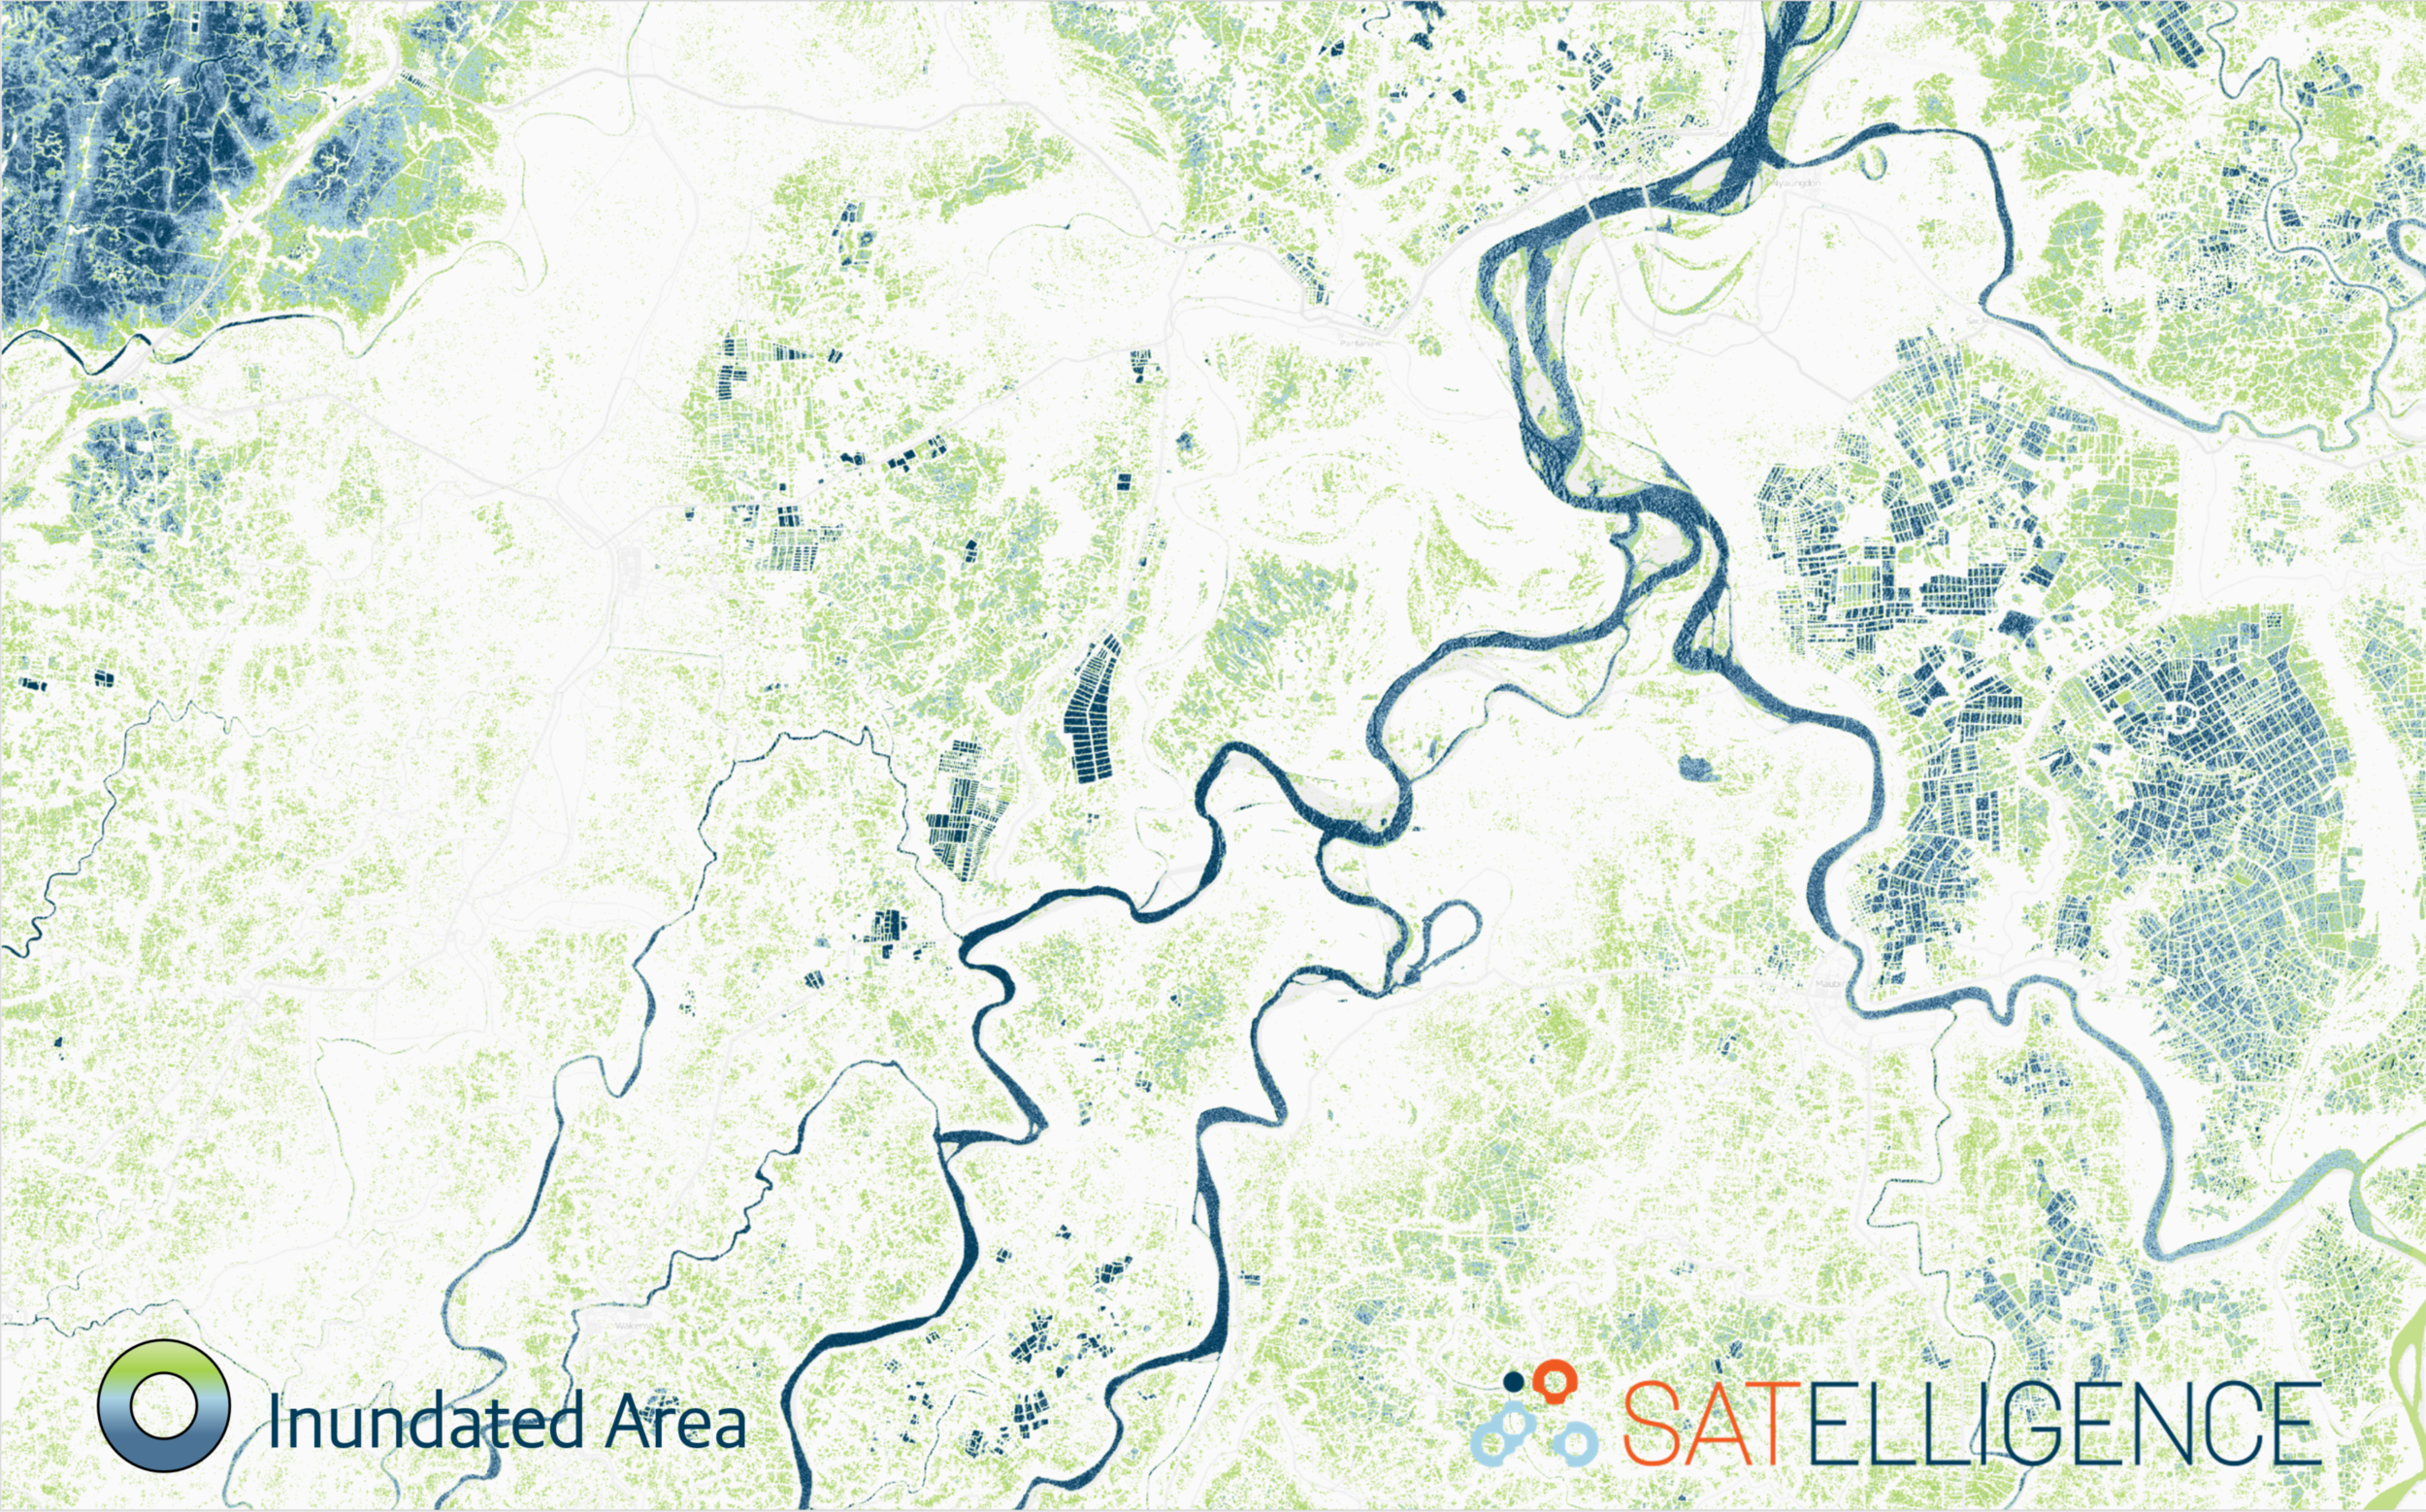
When zooming into the Irrawaddy delta, a lot more detail becomes available and inundated fields can clearly be distinguished:

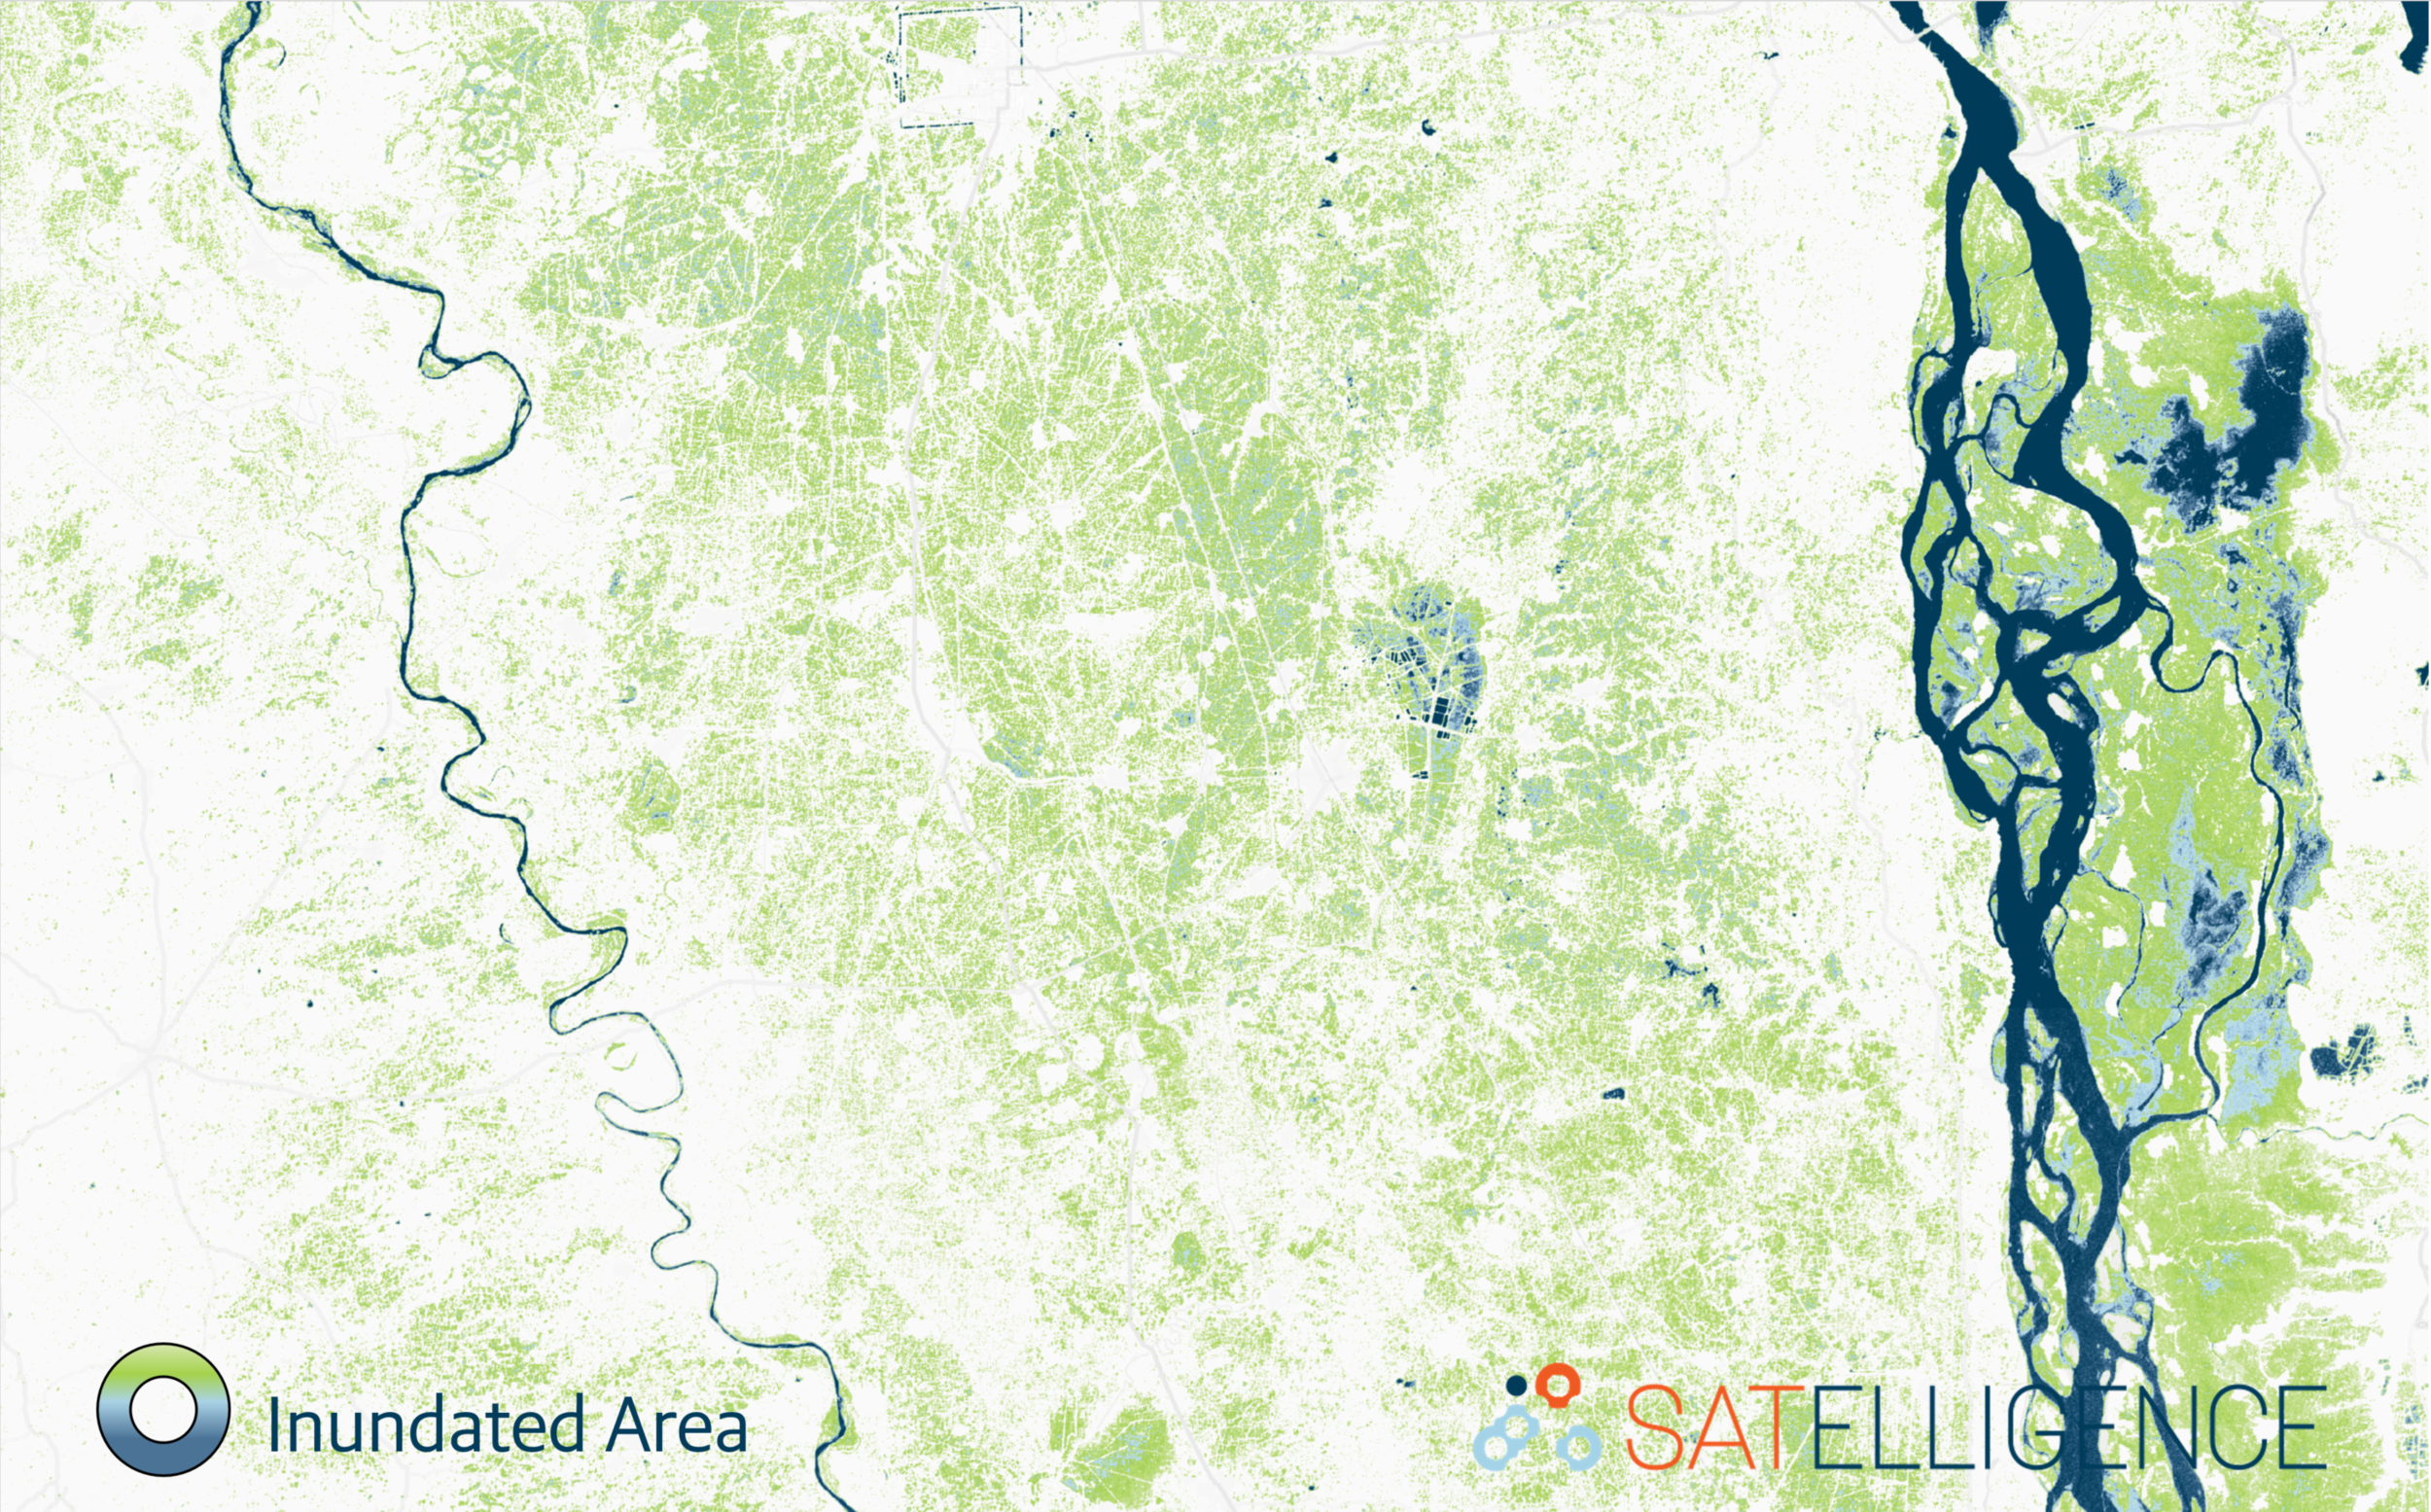
Up North, the Irrawaddy river morphology pattern stands out and, clearly, the areas next to the river are occasionally inundated during the year:

