Understanding the Importance of Location Data in Supply Chains
To address sustainability within an organisation, it’s crucial to have a clear understanding of your supply chain. This knowledge enables you to engage directly with suppliers (upstream) and customers (downstream) about priorities and improvements. However, navigating today’s complex and often non-transparent global value chains in agricultural commodities can be challenging. This is where traceability and data collection become essential.
Collecting high-quality data at scale is no small feat. It requires significant effort and trust between suppliers and customers. Supply chain data can range from high-level lists of tier 1 suppliers to granular details such as actual farm locations. For instance, tracking a commodity batch from farm to final packaged product, as seen with specialty coffees or fine wines, offers a high level of detail. However, in smallholder environments, suppliers only recently accelerated the challenge of gathering farm location data at scale, due to the remote and decentralised nature of smallholder supply chains.
For deforestation compliance, accurate farm location data is essential. While large industrial plantations in industries like palm oil have had this information for years, smallholder environments have only recently begun gathering farm location data at scale due to their remote and decentralised nature. The European Union Deforestation Regulation (EUDR) has further urged this development, requiring precise plot data for farms sourcing commodities.
The Role of Polygons in Data Collection
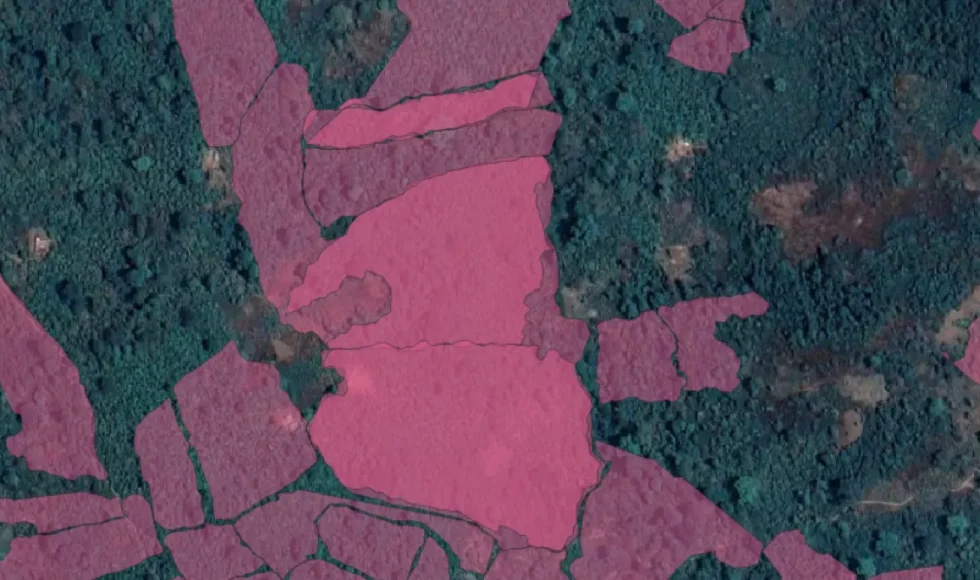
A polygon is a data model that represents a geographic shape, such as a farm plot.

Collection & Formatting
When collecting data, it’s essential to know the exact data points needed and their required format. Historically, the lack of formal data collection standards led to varying data quality across organisations. The EUDR now provides guidelines to standardise data structure and minimise unnecessary sharing of private farmer or supplier information. As a guiding principle, always obtain consent from the farmer owning the plot. Initiatives such as Digital Integration of Agricultural Supply Chains Alliance (DIASCA) aim to harmonise approaches to ensure industry alignment.
Location Information
Plot data can be collected as polygons (exact mapped boundaries) or points (a single coordinate indicating the general location). Under EUDR guidelines, point data is accepted only if the plot size is 4 hectares or smaller; otherwise, polygons are required. If the plot size is unknown, Satelligence assumes it is 4 hectares.
Data collection methods vary, from smartphone apps with GPS functions to handheld GPS devices for higher accuracy. These methods can collect additional data beyond location. However, drawing polygons on satellite imagery or using AI for field boundary recognition is often unreliable for smallholders.
Data Attributes
Below are the required attributes for processing location data, which must be included when submitting data to Satelligence. Other dataset information may be useful but will not be stored by Satelligence.

Supported File Types
Polygon and point data can be provided in the following geospatial data formats, unprojected with WGS84 datum (EPSG:4326):
- Shapefile (zip containing .shp, .shx & .dbf)
- GeoJSON (.geojson)
- Geopackage (.gpkg)
- Keyhole Markup Language (.kml or .kmz)
Point data is often stored as a spreadsheet, supported in the following format:
- Text comma-separated values (.csv)
When processing point data, Satelligence applies a radius to points to simulate circular plots of 4 hectares, or smaller if the plot area is available. Polygon plots are only validated for geometrical integrity upon submission and stored directly into our system.

Data Cleaning
Once the data is collected, it should be quality checked and cleaned before processing or sending it to Satelligence.
Visual check for outliers: polygons gathered in the field often contain one or more deviating coordinates due to a lower GPS accuracy.

If you are using QGIS you can verify the validity of the polygons with the tool Check Validity. In case invalid geometries are found, this results in a separate dataset with the farms that require fixing.

Repair invalid geometries: This is a standard tool in most modern GIS software (ArcGIS: Repair Geometry, QGIS: Fix Geometries). Note that while this tool will fix self-intersections of polygons, it will not improve the appearance of the plot or remove outliers. If there are many polygons with incorrect holes or errors, you can choose to apply a “convex hull,” which will return the outer boundaries of each polygon.

Remove polygons that are in the wrong place: Some points/polygons might end up in different countries/continents/offshore or far from the regular supply shed.

Remove null/empty geometries: Sometimes field data includes all necessary information (e.g., plot ID, supplier) but lacks geographic information. This makes the data unusable for GIS analyses and necessitates its removal. Note that these records may still contain valuable information, such as farm IDs and cooperative names. It’s best to keep a record of the removed farms so they can be updated in the future or forwarded to the original data supplier.
Remove duplicates: GIS software allows you to remove duplicate geometries within the same dataset, which is recommended to eliminate any overlap. However, many overlapping farms do not match exactly, causing these overlaps to be missed by automated tools. A visual method to check for overlaps is to apply a semi-transparent style to the dataset in your GIS software, making overlapping features more noticeable.
If polygon data is not available, GPS locations of your supply chain are the next best option. While these locations provide information about your sourcing regions, they do not specifically delineate the areas used for cultivation. These data are often available only in Excel files (xlsx), which makes visualising and checking the validity of the locations challenging. To visualise them, save the Excel file as a CSV with “longitude” and “latitude” columns containing the coordinates. This format can be seen in GIS software.

Make sure that coordinates are in the same reference system.
Avoid using coordinates in degrees, minutes, and seconds (e.g., 38°53′23″N, 77°00′32″W) because they are prone to errors when edited manually. Instead, use geographic coordinates in decimal degrees (e.g., 51.702, 5.545). The most commonly used coordinate system is unprojected with the WGS84 datum (EPSG:4326). If the coordinate system is undefined, you can use the “Assign projection” feature to ensure polygons and points are displayed correctly. If your data uses a local coordinate system, use “Reprojection” to translate the coordinates accordingly.
Conclusion
When the sourcing data has been collected and cleaned, you can use it for many different purposes, including complete visibility of sourcing origins for EUDR compliance. At Satelligence, we encourage leveraging the value of location data even more as a foundation for efficiently estimating carbon emissions or removals. Get in touch to learn more, and experience uploading polygons and GPS points directly into our platform to get deforestation insights.
Satelligence regularly organises Best Practice sessions for customers on topics such as this. During the interactive sessions, topics as such are discussed more in-depth and customers are invited to share their experiences and questions.