Authors: Sake Alkema, Rens Masselink, Niels Wielaard, Michel Wolters.
New forest regulations such as the EUDR require agricultural commodity producers and manufacturers to present satellite-based proof that their products are deforestation-free. Many people think open forest data is an easy, safe and free fix. But is it?
Read on to find out why open data is not safe:
- Open global datasets – even the official EC Forest Observatory global map of forest cover 2020 published for EUDR – are so inaccurate they cannot be used for due diligence compliance statements;
- Why? None of these datasets properly map perennial crop plantations like cocoa, coffee, rubber, oil palm, cashew etc. These are included in ‘forest’;
- Implication: clearing of planted crops is mistaken for deforestation, leading to an unfair exclusion of smallholders, reduction of sustainable volumes and exposure to huge EUDR fines;
- Well-meant advice to embrace open data just because it is cheap helps smallholders from bad to worse;
- Producer country maps cannot be used as-is either, as approximately 80% of countries have forest definitions that do not comply with the EUDR definition.
In part II of this blog series we will focus on solutions to make open data safe.
The challenge
For EUDR risk assessment it is important to know both the distribution of forest in the year 2020 and its conversion to any other land uses in following years:
Deforestation is defined as “conversion of forest to agricultural use” (see Article 2(3). Accordingly, only the clearing of forest followed by e.g. planting of an EUDR commodity is considered deforestation, and therefore non-compliant.
If a forest area is cleared and not planted with an EUDR commodity crop, it is not considered ‘EUDR deforestation’. Any subsequent detection of fallow land, forest regrowth, urban development, road development or annual crop production by smallholders does not qualify as ‘EUDR deforestation’.
Clearly, this implies that using deforestation alerts only – without land use change information – is pointless. Having data on agricultural use, i.e. planted commodity maps, is critical.
Is such data available in the public domain?
Open data solutions are not safe
A growing number of global open forest, land cover and deforestation datasets is available online. Examples include Global Forest Watch – Hansen tree cover data [1] JAXA Forest/Non Forest layer [2], ESA WorldCover [3], Google Dynamic World [4], ESRI Land Use/Cover [5], JRC Tropical Moist Forest [6], EU Forest Observatory Global 2020 map of forest cover [7], GLAD alerts [8], RADD alerts [9] and others.
Many people think that such datasets are fit for any purpose, which is not the case.
Open data is great for global stocktaking, for raising awareness, and a good first step to identify cases to be explored in more detail. Due diligence at the plot level is certainly not one of such purposes:
The European Forest Institute assessed the role of spatial information for EUDR due diligence and concluded that the majority of open datasets is not aligned with EUDR’s forest definition, see Table 1 [10].
Table 1. Publicly available datasets on forest taken from [10]
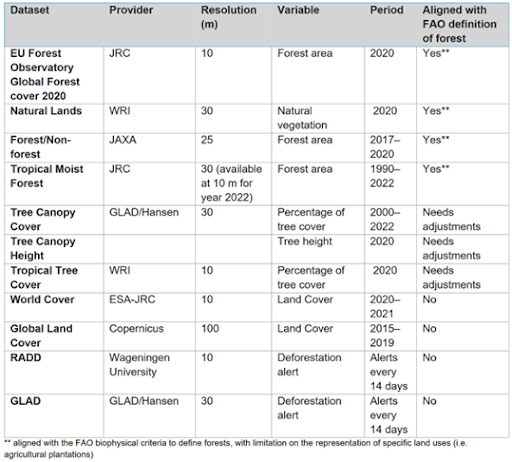
Even layers that EFI qualifies as ‘aligned’ may not be applicable in current form, as we will show below. Note that we do not include WRI Natural Lands and JRC Tropical Moist Forest in our examples here, since these layers either are not accessible, or do not cover all EUDR forest, and still do not address commodity correction sufficiently.
Problem with global maps
Let’s look at this in detail for Côte d’Ivoire, the world’s largest producer of cocoa. According to the official statistics of the FAO Food and Agriculture Organization Global Forest Resource Assessment 2020 almost 9% of the country is forested [11].
By sharp contrast, the amount of tree or forest cover as judged by the open datasets ranges from a whopping 40% to 95% (see figure 1 below). This obviously points to a significant overestimation of forest.

So, why do these estimates vary so wildly, and why are these global maps considered not accurate enough for due diligence?
The global maps often consider ‘tree cover’ instead of forest, and typically mix perennial crops and natural forest. The known shortcomings of Global Forest Watch have been widely debated and properly flagged by both University of Maryland and WRI. For an overview see our previous viral post, in particular the annex [12].
The fact that perennial crops such as oil palm, rubber, cocoa, and coffee are not properly distinguished and therefore wrongly mapped as ‘forest’ in open data is the most critical flaw. As pruning or clearing of plantations is then confused with deforestation, you are exposed to fines of up to 4% of your turnover (EUDR).
Problems with Forest Observatory 2020 map
The problem of unmapped perennial crops also affects the most important open dataset for EUDR: European Commission’s Forest Observatory global map of forest cover for 2020 produced by Joint Research Centre (JRC) [7]. Its purpose is ‘guidance’ for EUDR risk assessment; the map has no legally-binding status.
Apparently, the Forest Observatory 2020 forest distribution has been manually corrected by using separate layers of plantations, such as high resolution oil palm maps [13] as masks. Despite this, critical issues are reported on the JRC web page, most notably including the overestimation of forest cover [14].
Over the past years, Satelligence has specialized in mapping planted commodities globally with plot level detail [15]. Further details will be shared in Part II of this blog.
We overlaid our palm oil, cocoa, coffee, rubber and other commodity layers on the Observatory 2020 map. This analysis clearly shows the issue of overestimation in the Observatory 2020 map is fatal for many key sourcing regions. The selected examples from Nigeria, Côte d’Ivoire, and Brazil across palm, cocoa, rubber, and coffee growing regions speak for themselves:
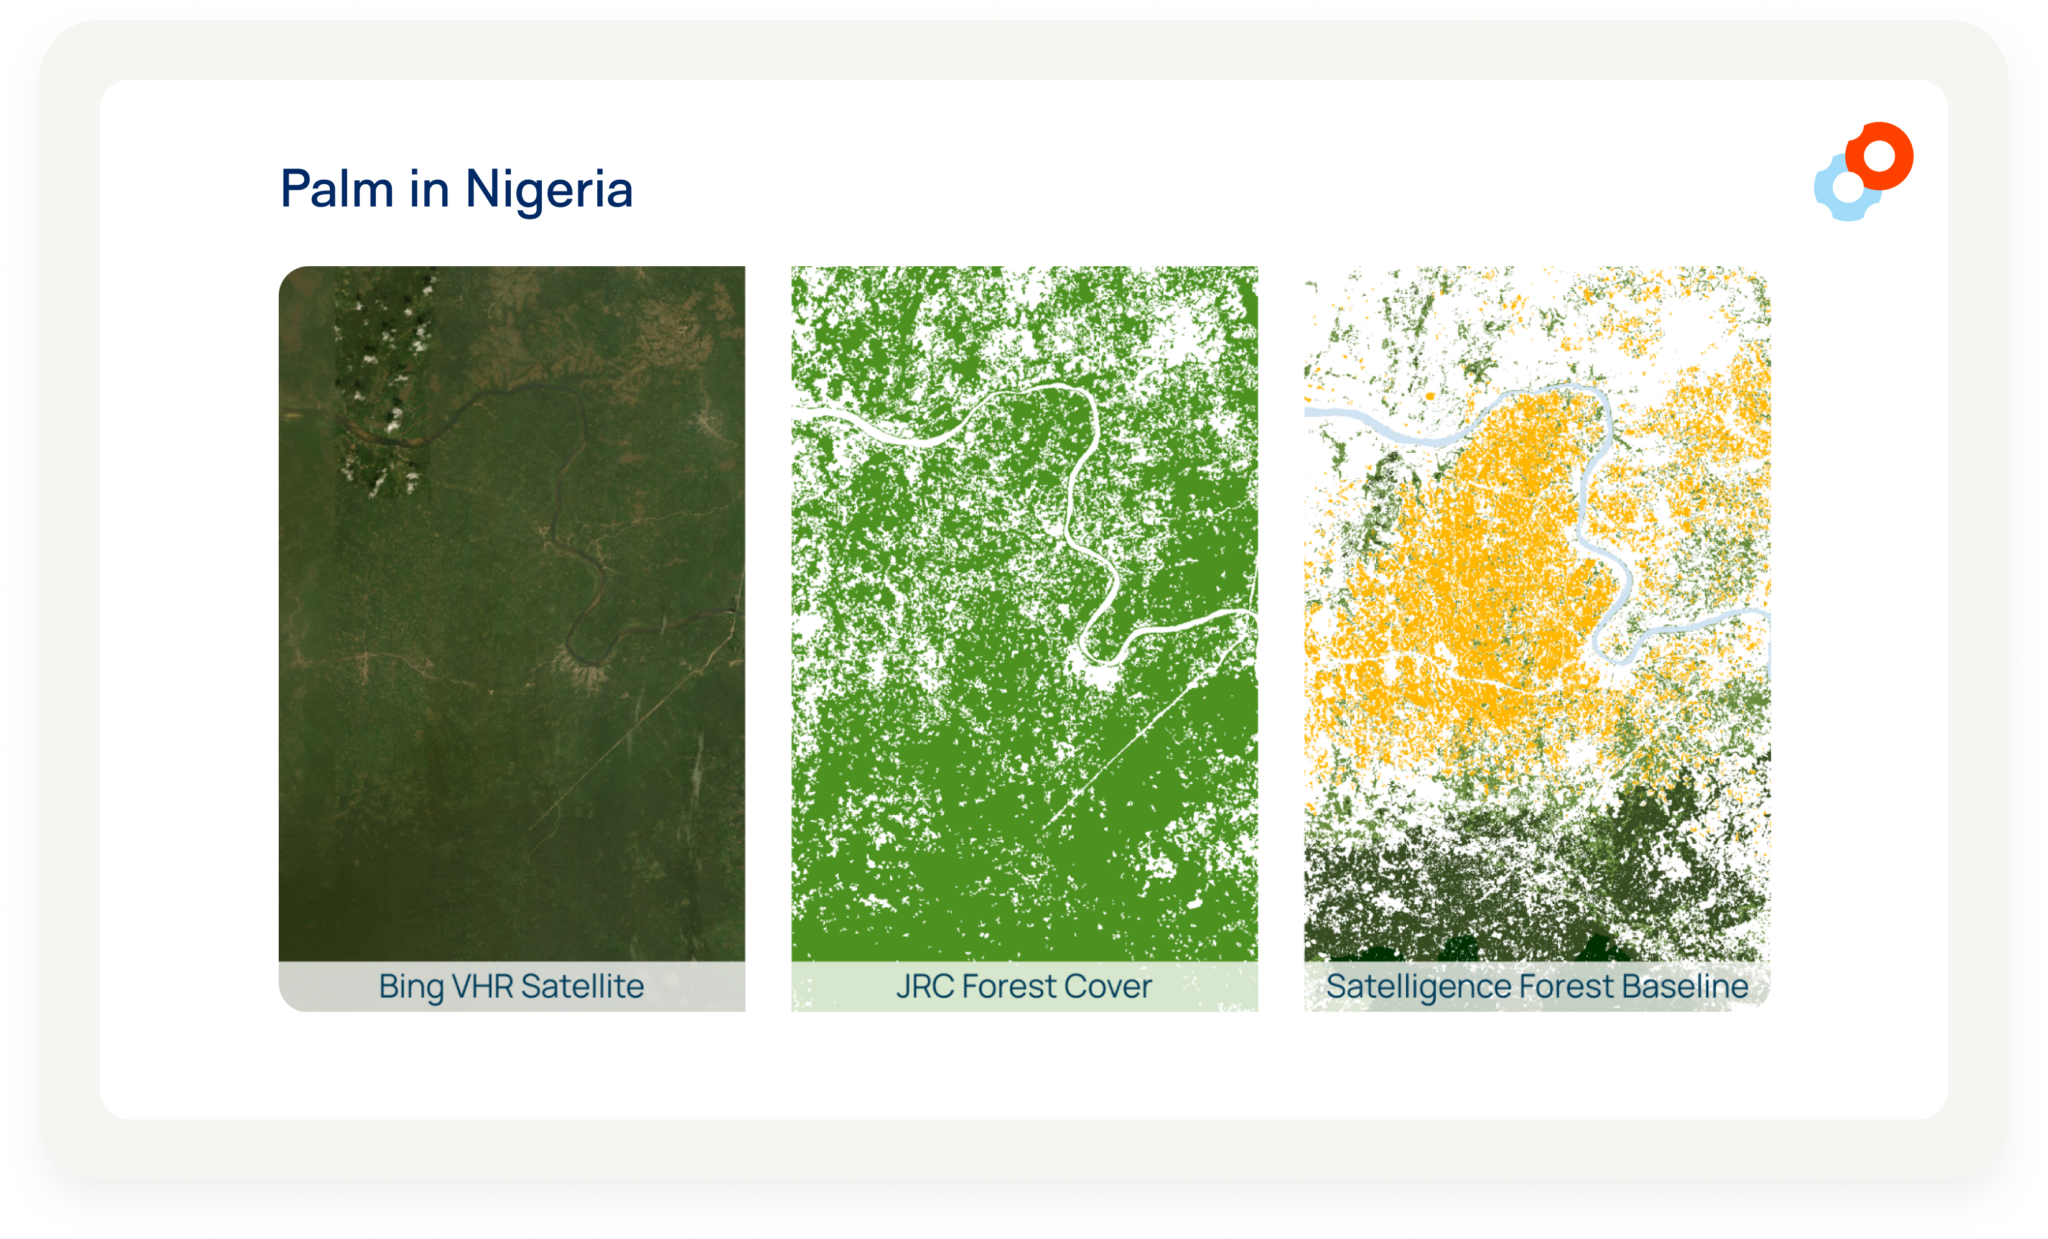
An example of differences between the Observatory 2020 map (JRC forest cover) and the Satelligence forest baseline in Nigeria (5.946° 8.603°). The image on the left shows a recent VHR image from Bing, the image in the middle shows the JRC forest cover 2020 layer with the forest cover in green. The image on the right shows the Satelligence forest baseline with forest in green tones, oil palm plantations in yellow, water in blue, and white is ‘other’.
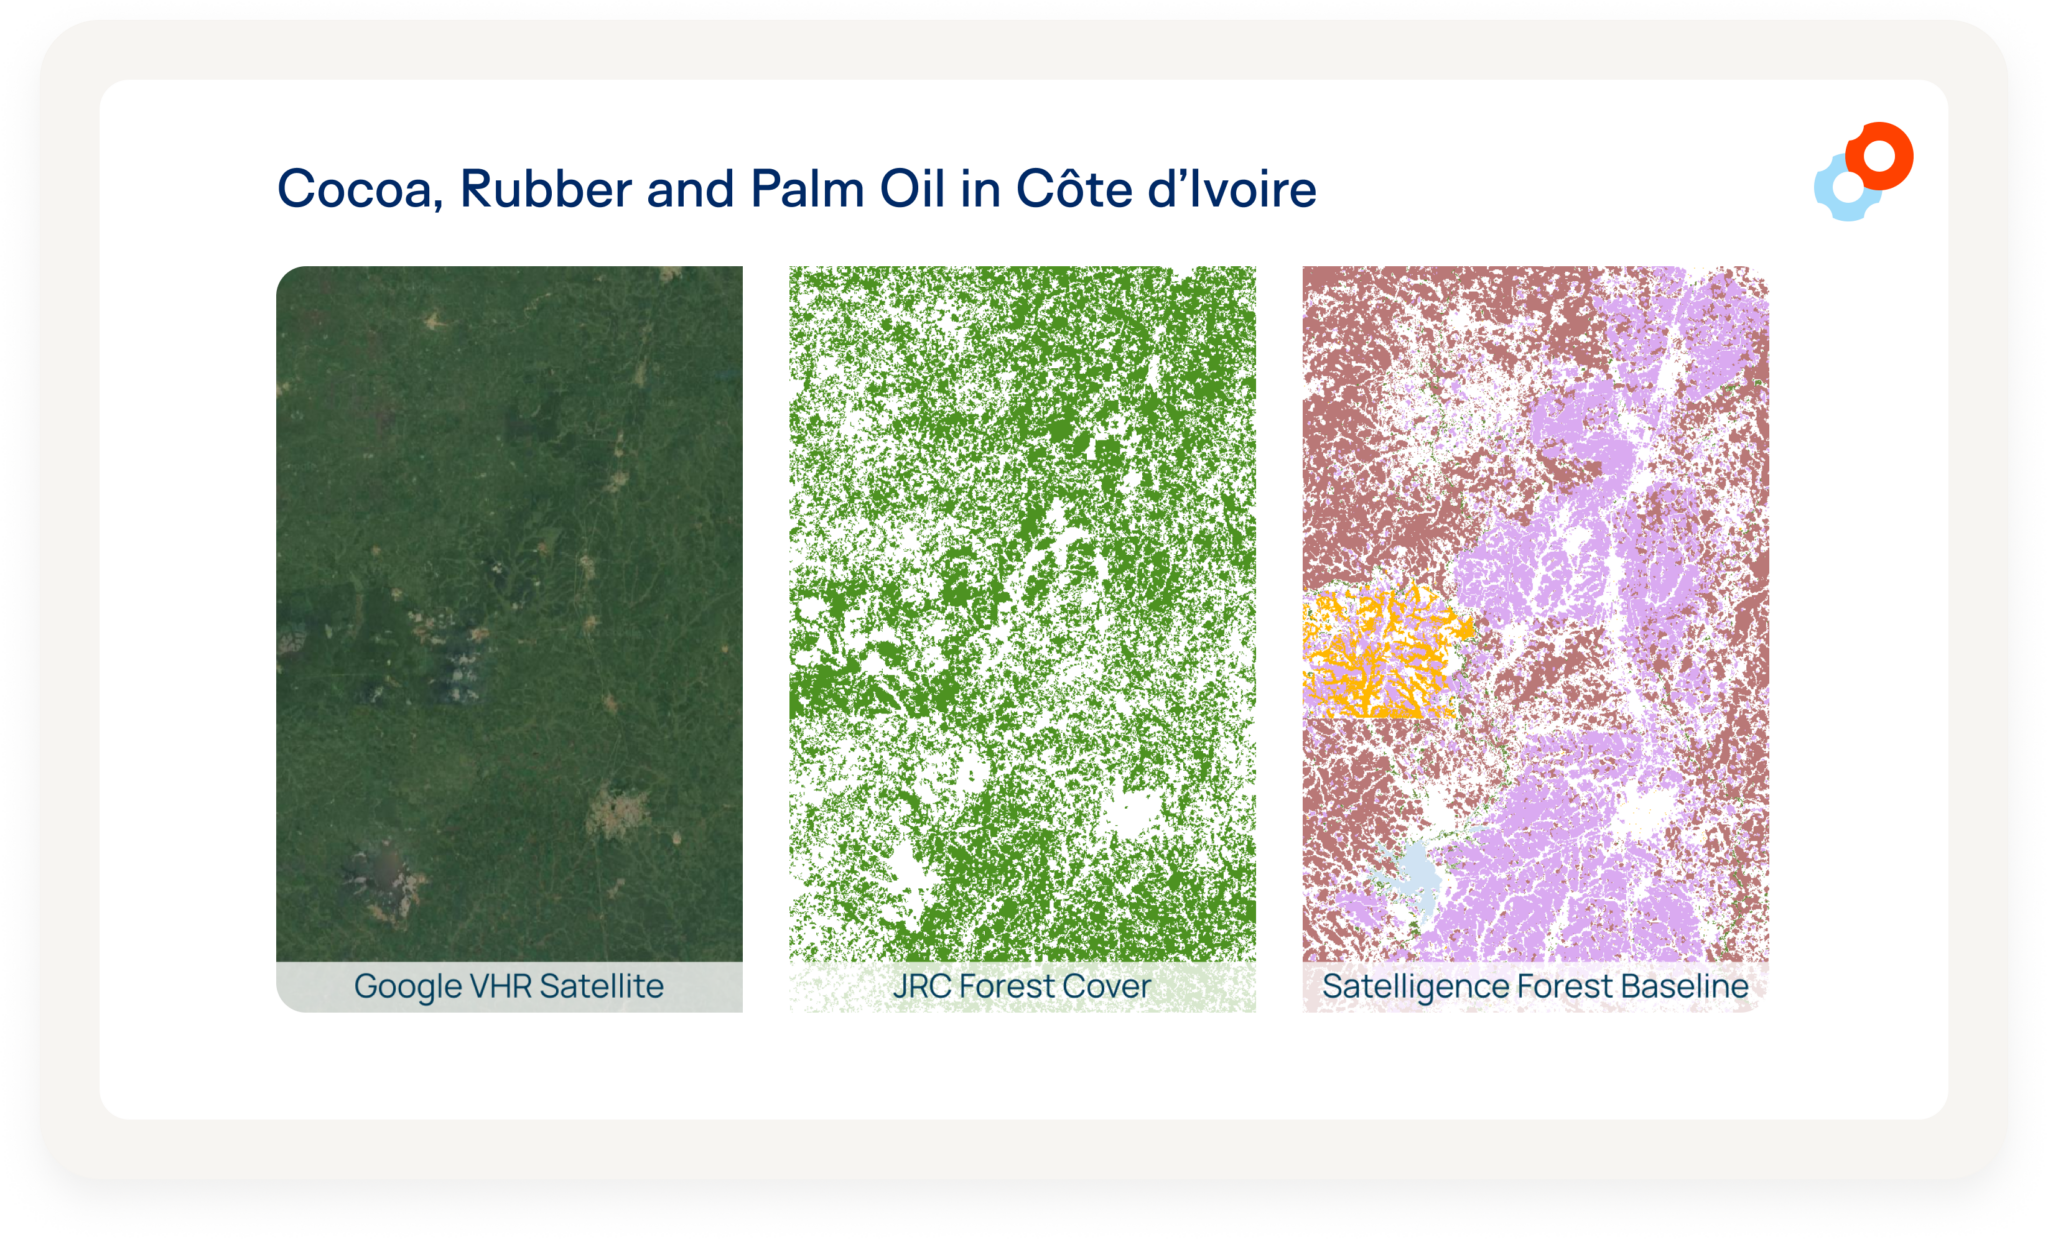
An example of differences between the JRC forest cover layer and the Satelligence forest baseline in Côte d’Ivoire (5,098° -6,567°). The image on the left shows a recent VHR image from Google, the image in the middle shows the JRC forest Cover 2020 layer with the forest cover in green. The image on the right shows the Satelligence forest baseline with forest in green tones, oil palm plantations in yellow, cocoa in brown, rubber in purple, water in blue, and white is ‘other’.
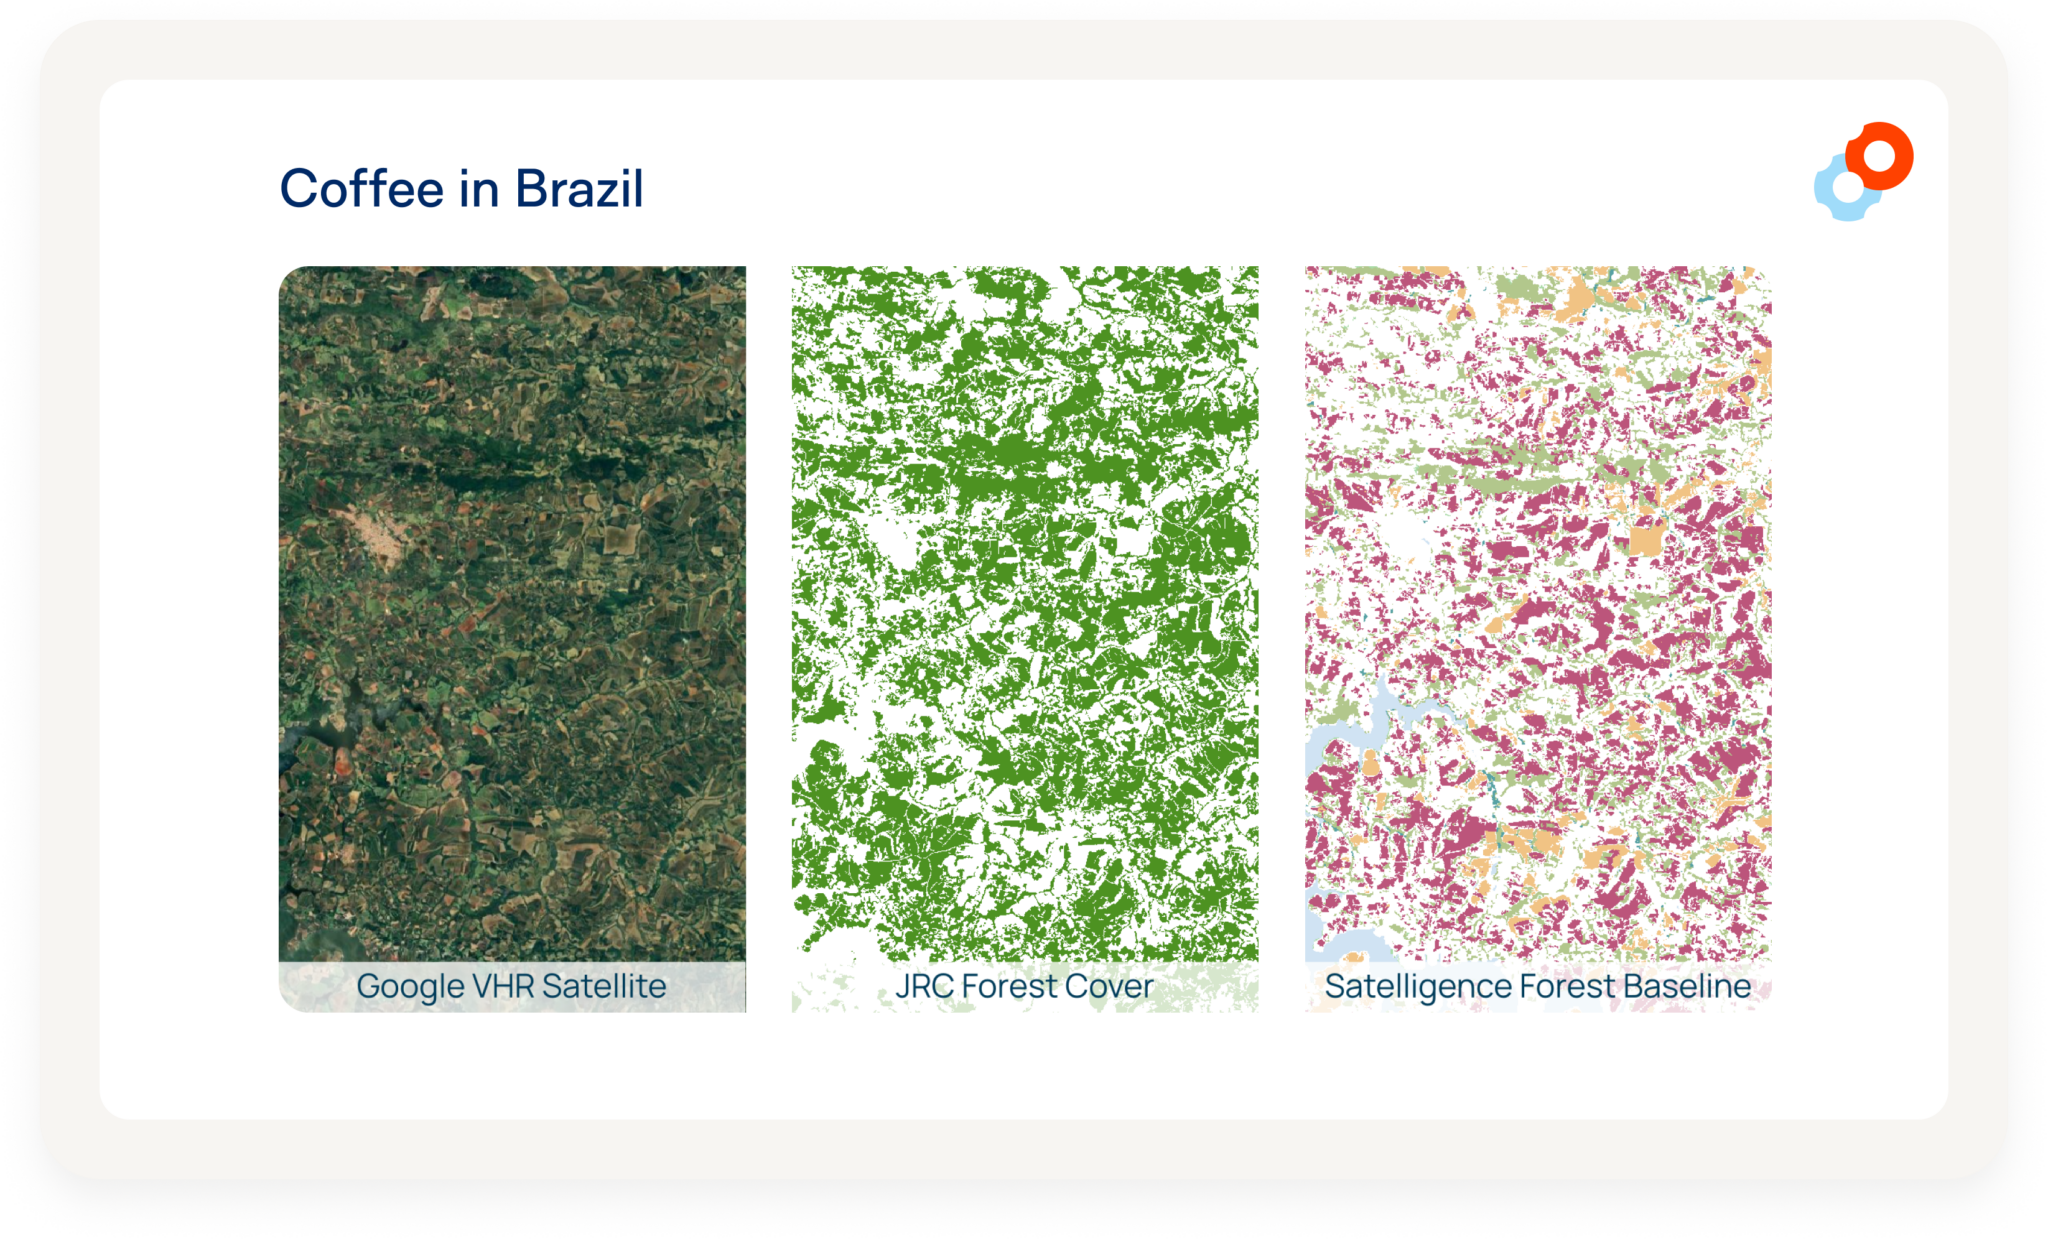
An example of differences between the JRC forest cover layer and the Satelligence forest baseline in Brazil (-21,290° -45,567°). The image on the left image shows a recent VHR image from Google, the image in the middle shows the JRC forest cover 2020 layer with the forest cover in green. The image on the right shows the Satelligence forest baseline with forest and native vegetation in green tones, coffee in dark red, soy in orange, water in blue, and white is ‘other’.
Back to the Cote d’Ivoire example. If we overlay our in-house database of circa 1.1 million cocoa plot boundaries available from our many clients, we find that up to 60% of smallholder plantations overlap with green ‘forest’ on the Observatory 2020 map.
As pruning or clearing of old unproductive or illegal plantations for replanting within such areas will be mistaken for deforestation, this effectively leads to excluding smallholders from European markets on false grounds.
Fern and the Ivorian NGO IDEF confirm this is a real problem on the ground [16]:
“Changes that appear in the GFW data are not deforestation, but clearances of illegal cocoa plantations by the government parks agency.” They go on to stress that “Satellite images must be coupled with ground-truthing field surveys”.
The fact that most EUDR service providers use GFW and/or other open datasets, will put their clients at significant risk of fines, or at best unnecessarily reduce their compliant volumes dramatically.
Official government data not aligned
Would local national datasets be a useful alternative? Unfortunately not.
Assessing the national forest definitions of the main producers of tropical forest commodities, we find that ~80% have a definition that does not align with the one for EUDR. Countries have often defined a different canopy percentage, height and/or minimum area.
Because of this, most currently available national land cover maps cannot be used for EUDR compliance monitoring either.
Even for a country like Brazil that uses the same forest definition as EUDR, and has fantastic monitoring tools, national data is not necessarily compliant. The PRODES deforestation monitoring system [17] offers only 6.25ha detail, while EUDR requires 0.5ha. Moreover, PRODES data is released only once a year, while producers will want near-real time data to check their shipments on an ongoing basis.
To conclude
Open data is fantastic, and Satelligence has actively funded and promoted its existence [18]. However:
Our advice is not to use any global dataset for precise and accurate monitoring of local plots, due diligence and submission of compliance statements. Global maps are just not designed for such purposes.
Consult a specialist for curation, adjustment, and contextualisation of open data layers to make them safe:
We have shown here how open data severely overestimate forest derived from tree cover and therefore deforestation. The main reason is that perennial crops are not mapped.
Even the Forest Observatory 2020 forest cover map should not be used for due diligence, as it will lead to many false positive deforestation alerts. Not only smallholder palm, cocoa, rubber and coffee are misrepresented as forest, but some large scale plantations as well.
Smallholders suffer disproportionately, as their plantations are typically not on maps based on open data. Well-meant advice to embrace open data just because it is cheap, helps smallholders from bad to worse. This effectively leads to excluding smallholders from European markets on false grounds.
Businesses and service providers using open data as a single source of truth will be exposed to significant risks ranging from reduced compliant volumes to higher exposure to fines.
Read Part II of this blog series to learn how Satelligence crafted a forest baseline mapping global commodities, building on open data and methods, and significantly reducing the presence of false positives to ensure deforestation-free compliance with EUDR.
References
[1] Hansen, M. C., P. V. Potapov, R. Moore, M. Hancher, S. A. Turubanova, A. Tyukavina, D. Thau, S. V. Stehman, S. J. Goetz, T. R. Loveland, A. Kommareddy, A. Egorov, L. Chini, C. O. Justice, and J. R. G. Townshend. 2013. High-Resolution Global Maps of 21st-Century Forest Cover Change. Science 342 (15 November): 850-53.
[2] Shimada, M., Itoh, T., Motooka, T., Watanabe, M., Shiraishi, T., Thapa, R., Lucas, R. 2014. New global forest/non-forest maps from ALOS PALSAR data (2007–2010). Remote Sens. Environ. 155, 13–31.
[3] Zanaga, D., Van De Kerchove, R., De Keersmaecker, W., Souverijns, N., Brockmann, C., Quast, R., Wevers, J., Grosu, A., Paccini, A., Vergnaud, S., Cartus, O., Santoro, M., Fritz, S., Georgieva, I., Lesiv, M., Carter, S., Herold, M., Li, Linlin, Tsendbazar, N.E., Ramoino, F., Arino, O., 2021. ESA WorldCover 10 m 2020 v100.
[4] Brown, C.F.; S.P. Brumby, B. Guzder-Williams, T. Birch, S. Hyde, J. Mazzariello, W. Czerwinski, V.J. Pasquarella, R. Haertel, S. Ilyushchenko, K. Schwehr, M. Weisse, F. Stolle, C. Hanson, O. Guinan, R. Moore, A.M. Tait. 2022. Dynamic World, Near real-time global 10 m land use land cover mapping. Scientific Data, 9(1), 251.
[5] Karra, K., C. Kontgis, Z. Statman-Weil, J.C. Mazzariello, M. Mathis, S.P. Brumby. 2021. “Global land use/land cover with Sentinel-2 and deep learning.” IGARSS 2021-2021 IEEE International Geoscience and Remote Sensing Symposium. IEEE.
[6] C. Vancutsem, F. Achard, J.-F. Pekel, G. Vieilledent, S. Carboni, D. Simonetti, J. Gallego, L.E.O.C. Aragão, R. Nasi. 2021. Long-term (1990-2019) monitoring of forest cover changes in the humid tropics. Science Advances.
[7] Bourgoin, C. I. Ameztoy, A. Verhegghen, S. Carboni, R. Colditz, F. Achard. 2023. Global map of forest cover 2020 – version 1. European Commission, Joint Research Centre (JRC) [Dataset] PID: http://data.europa.eu/89h/10d1b337-b7d1-4938-a048-686c8185b290.
[8] Hansen, Matthew C., Alexander Krylov, Alexandra Tyukavina, Peter V. Potapov, Svetlana Turubanova, Bryan Zutta, Suspense Ifo, Belinda Margono, Fred Stolle, and Rebecca Moore. “Humid Tropical Forest Disturbance Alerts Using Landsat Data.” Environmental Research Letters 11, no. 3 (2016): 034008. https://doi.org/10.1088/1748-9326/11/3/034008.
[9] Reiche J, Mullissa A, Slagter B, Gou Y, Tsendbazar N, Odongo-Braun C, Vollrath A, Weisse M, Stolle F, Pickens A, Donchyts G, Clinton N, Gorelick N & Herold M, (2021), Forest disturbance alerts for the Congo Basin using Sentinel-1, Environmental Research Letters, https://doi.org/10.1088/1748-9326/abd0a8.
[10] EFI. 2023. The role of spatial information for EUDR due diligence. Cocoa Insight / November 2023. Available online: https://efi.int/sites/default/files/files/flegtredd/Sustainable-cocoa-programme/Cocoa%20insights/EFI%20Cocoa%20Insight%201%20EN.pdf.
[11] FAO. 2020. Global Forest Resources Assessment 2020 (FRA 2020), Food and Agriculture Organization of the United Nations. Rome (URL: https://doi.org/10.4060/ca9825en).
[12] Wielaard N.R., 2023. Available online: https://www.linkedin.com/pulse/houston-we-have-sustainability-data-integrity-problem-niels-wielaard/.
[13] Descals, Adrià, et al. “High-resolution global map of smallholder and industrial closed-canopy oil palm plantations.” Earth System Science Data 13.3 (2021): 1211-1231.
[14] JRC. 2023. Available online: https://forobs.jrc.ec.europa.eu/GFC#know_issues.
[15] Masselink, R., M. Wolters, S. Alkema, N.R. Wielaard. 2022. Global mapping of soft commodities at scale: Examples from the palm oil and cocoa sectors. Paper presented at Living Planet Symposium, LPS 2022, Bonn, North Rhine-Westphalia, Germany.
[16] Fern. 2023. Online: https://www.fern.org/publications-insight/ivorian-ngo-identifies-issues-related-to-implementing-the-eu-deforestation-regulation-in-the-cocoa-sector-2639/.
[17] INPE. TerraBrasilis. PRODES (Deforestation). Available online: http://terrabrasilis.dpi.inpe.br/app/map/deforestation?hl=pt-br.
[18] RADD. 2019. Available online: https://www.wri.org/news/release-palm-oil-industry-jointly-develop-radar-monitoring-technology-detect-deforestation.
