Imagine you receive your first deforestation alert. It is based on the latest satellite technology and very detailed. You can see forest cover change at sub-meter scale. But when you call your supplier he tells you he already knew that for 3 months. It also appears that what you see as deforestation is actually oil palm replanting. What happened?
Sometimes clients ask us to use the latest and highest resolution satellite data available. At first glance, you might think: “That makes sense because then you can more accurately map deforestation”. But actually, we base our deforestation alerts on open – free available – satellite data at 10m detail.
Why do we use 10m data? Because we learned that people doing visual interpretation using very high detail imagery generally produce lower detail output and deforestation risk is mostly associated with clearings larger than a single tree. While clients increasingly require coverage of millions of square kilometers which means we need a scalable solution. This means you don’t always need the most detailed and expensive information available. But how can we be so sure about that?
In this blog we will tell you about how we don’t think expensive very-high resolution (VHR) data is necessary for monitoring your supply chain, by comparing VHR images to our detection system. After this, we will tell you 3 different stories on how we know our system is very accurate and timely.

“To make sure you get the best results we continuously check our algorithms for timeliness, spatial resolution and accuracy”
Free available data may sound a bit cheap. But if you want your deforestation alert to be of any use, reliability is most important. To make sure you get the best results we continuously check our algorithms for timeliness, spatial resolution and accuracy.
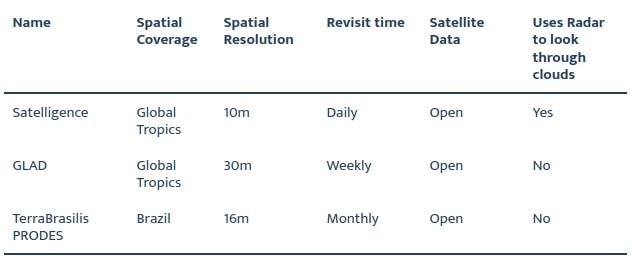
Furthermore, we compare our algorithms to other available systems out there; see table below.
Checking temporal resolution of commercial data
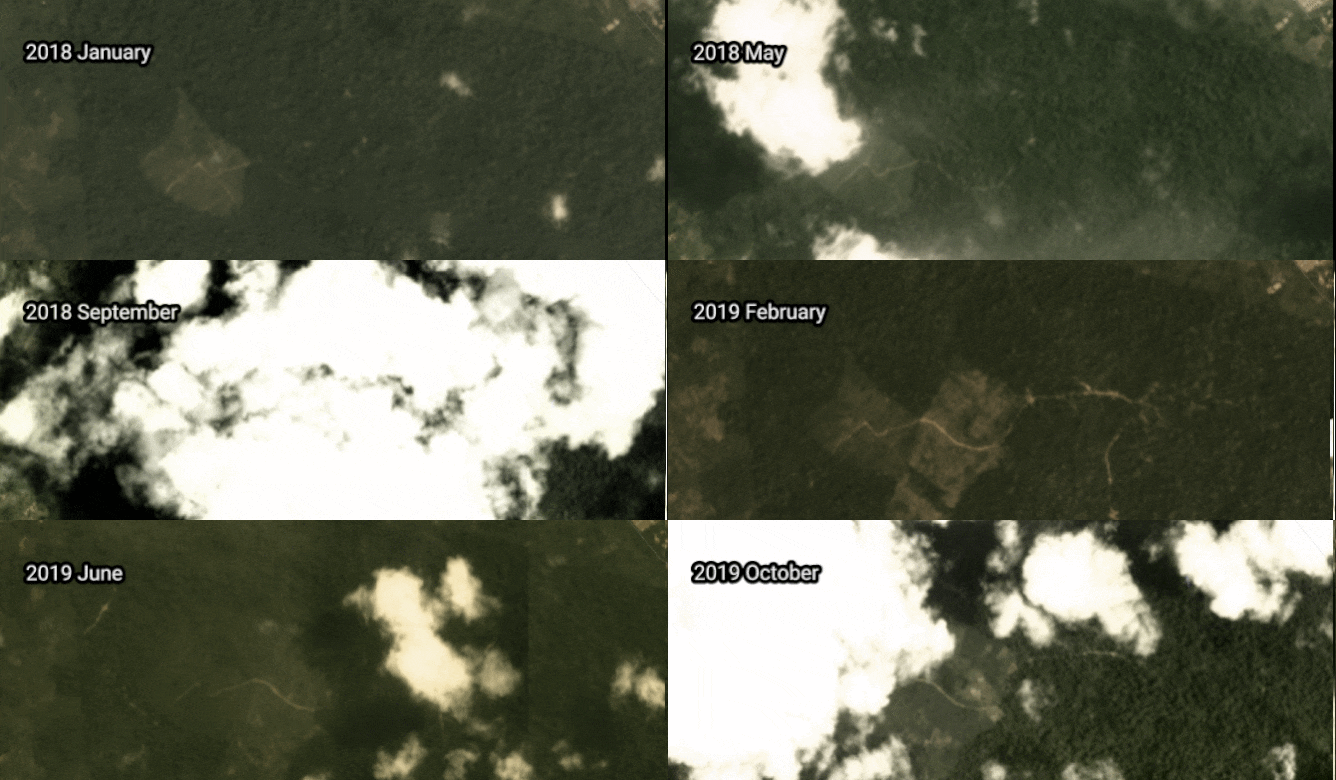
We sometimes get the question why we do not use Planet Imagery for our services, because then you’d get daily imagery. Planet is a fantastic source for imagery for many applications, for e.g. baseline data and agricultural applications. Also for change detection a daily revisit time is great. But for the areas we work in, a daily revisit time does not help much if all of your area is covered in clouds almost perpetually. That is why radar data is necessary.
We realise that images speak louder than words, so below you can see an area we mapped in Ghana (see story 2 below), but then in monthly “cloud-free” composites from Planet. In the animation you can clearly see that there are a lot of months in the year when the area is still covered by clouds.
We cannot compare our system to other providers that use high to very-high resolution (VHR) data for deforestation detection. This is because their products and services are commercially and therefore not available for testing. What we can do, however, is to make the case why you do not need them. Because this is crucial for understanding what makes a reliable and usable deforestation alert, we will tell you what we think of VHR first.
“For the areas we work in, a daily revisit time [of optical imagery] does not help much if all of your area is covered in clouds almost perpetually”
If we were to include Planet imagery into our service, we would get a minor increase in accuracy and timeliness, but this would increase the cost of the service significantly. And that while using the combination of the Sentinel-1, Sentinel-2 and Landsat constellations, we can get up to almost-daily updates of many places in the tropics anyway!
Spatial resolution of commercial data
High to very-high resolution (VHR) deforestation products are available to the market. These can range from lower than 10m down to 50cm for satellite services. The idea is that, using these services you can get more accurate deforestation products. Although intuitively this might seem true, we find it is a typical case of searching for an elephant with a microscope. We believe you need the right tool for your problem, and 10m pixel size is more than enough for almost all applications.
“Our work on quality control shows that we can accurately detect tree cover loss as small as 0.05ha”
Below you see an example of the Satelligence change detection at work in a small area in Sumatra, Indonesia. The deforested patch is about ~0.15 ha and the algorithm picks up the tree cover loss very nicely. Our work on quality control shows that we can accurately detect tree cover loss as small as 0.05ha.
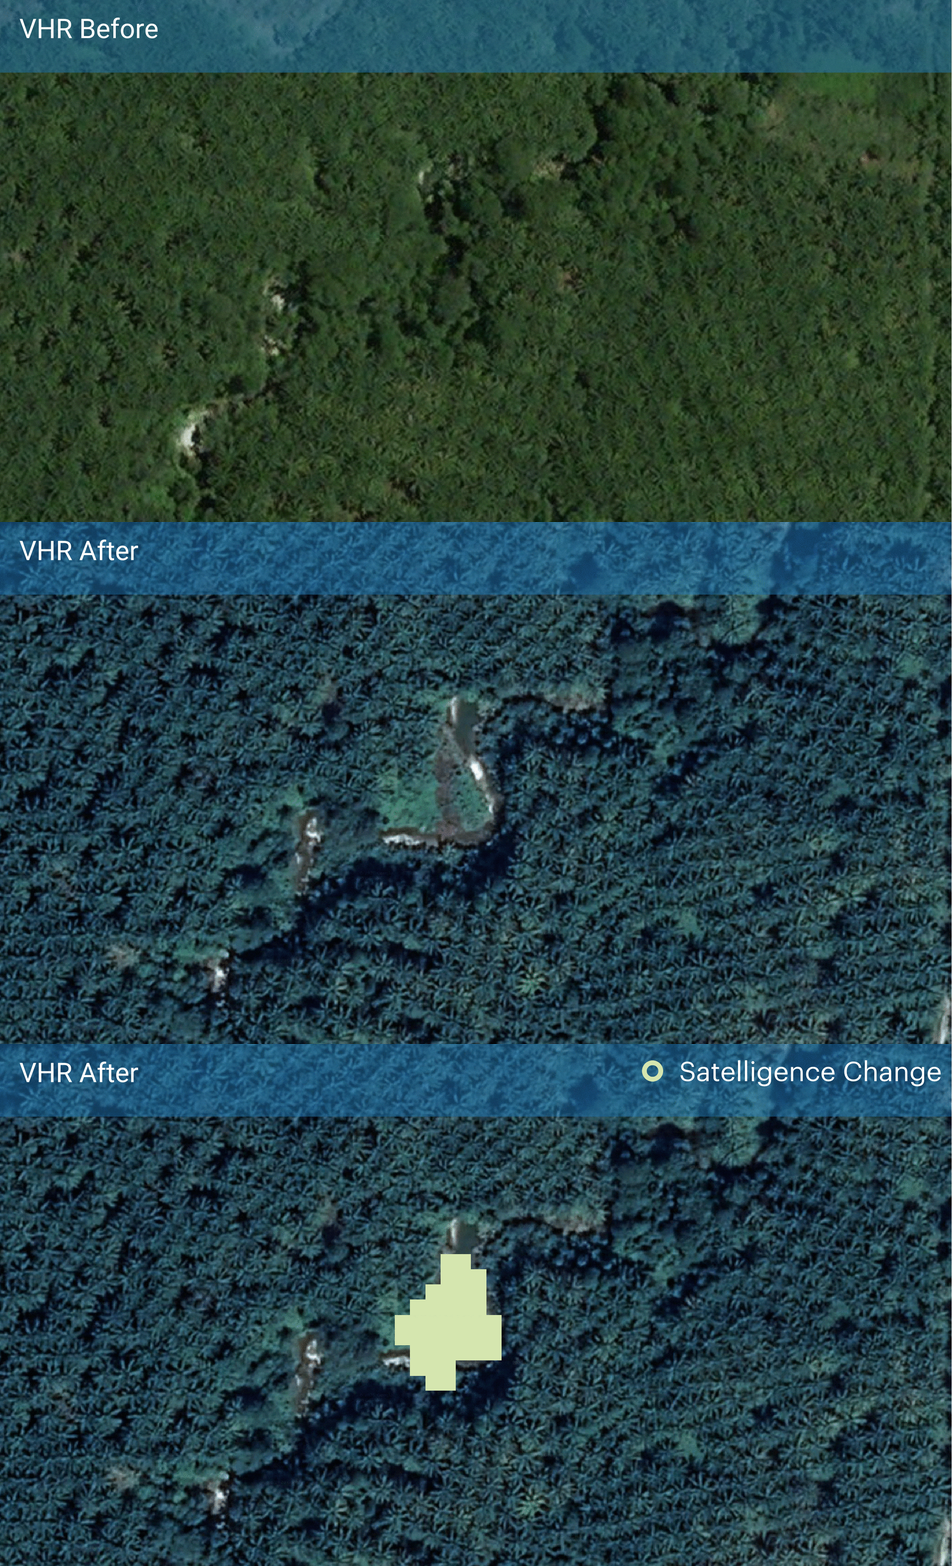
The question, however, is: do you really need this kind of detail everywhere?
Seeing every tree fall leads to information overload. Most importantly, at this level of detail you are actually monitoring forest degradation. The definition of deforestation in many countries refers to areas of tree cover loss larger than 0.5 or 1 hectare. This means that Sentinel-type data is more than sufficient for highly detailed, fast and accurate detection, and that commercial very-high resolution data is not needed as the basis of a global supply chain monitoring service.
“Sentinel-type data is more than sufficient for highly detailed, fast and accurate detection […] for a global supply chain monitoring service”
Additionally, using commercial very-high resolution data comes at a price. A quite steep price. The prices range from around 5 USD for 1.5m imagery to almost 30 USD for 50cm imagery for a single km2. These are all higher than we charge for a complete service!
3 stories using open satellite data
By using open data programs such as Sentinel (Copernicus) and Landsat (USGS), we can provide our clients with deforestation information with almost daily, 10m updates. The Sentinel-1, Sentinel-2 and Landsat satellites provide all the information we need to provide these alerts to our clients to fight deforestation around the world. These 3 stories tell you how we know.
Testing our deforestation detection accuracy in Papua New Guinea
If you want to assess the accuracy of a near-real time deforestation detection algorithm, you need to create a reference dataset of areas that have, and have not been deforested. But to do that, you first need to know where the forest is and where plantations are. Such a forest and plantation baseline is important if you want to be sure you only classify deforestation and not plantation clearing. Wait for our next technical blog if you want to know how we make such maps.
Determining ground truth data
The reference dataset of a set of polygons (a digital representation of an area) which we know have been deforested and a set of polygons which we know have not been deforested is created using visual interpretation of Sentinel-2 and Planet Imagery. Additionally, we use field sample data from our partners on the ground and our forest and plantation baseline to make sure we only classify deforestation (more on this in a future blog).
Comparing these reference polygons with our algorithm results we 1) can check how much deforestation we are potentially missing (false negatives), and 2) see how much our algorithm wrongly classified as deforestation (false positives). This analysis gives us valuable feedback on the performance of the deforestation detection system.
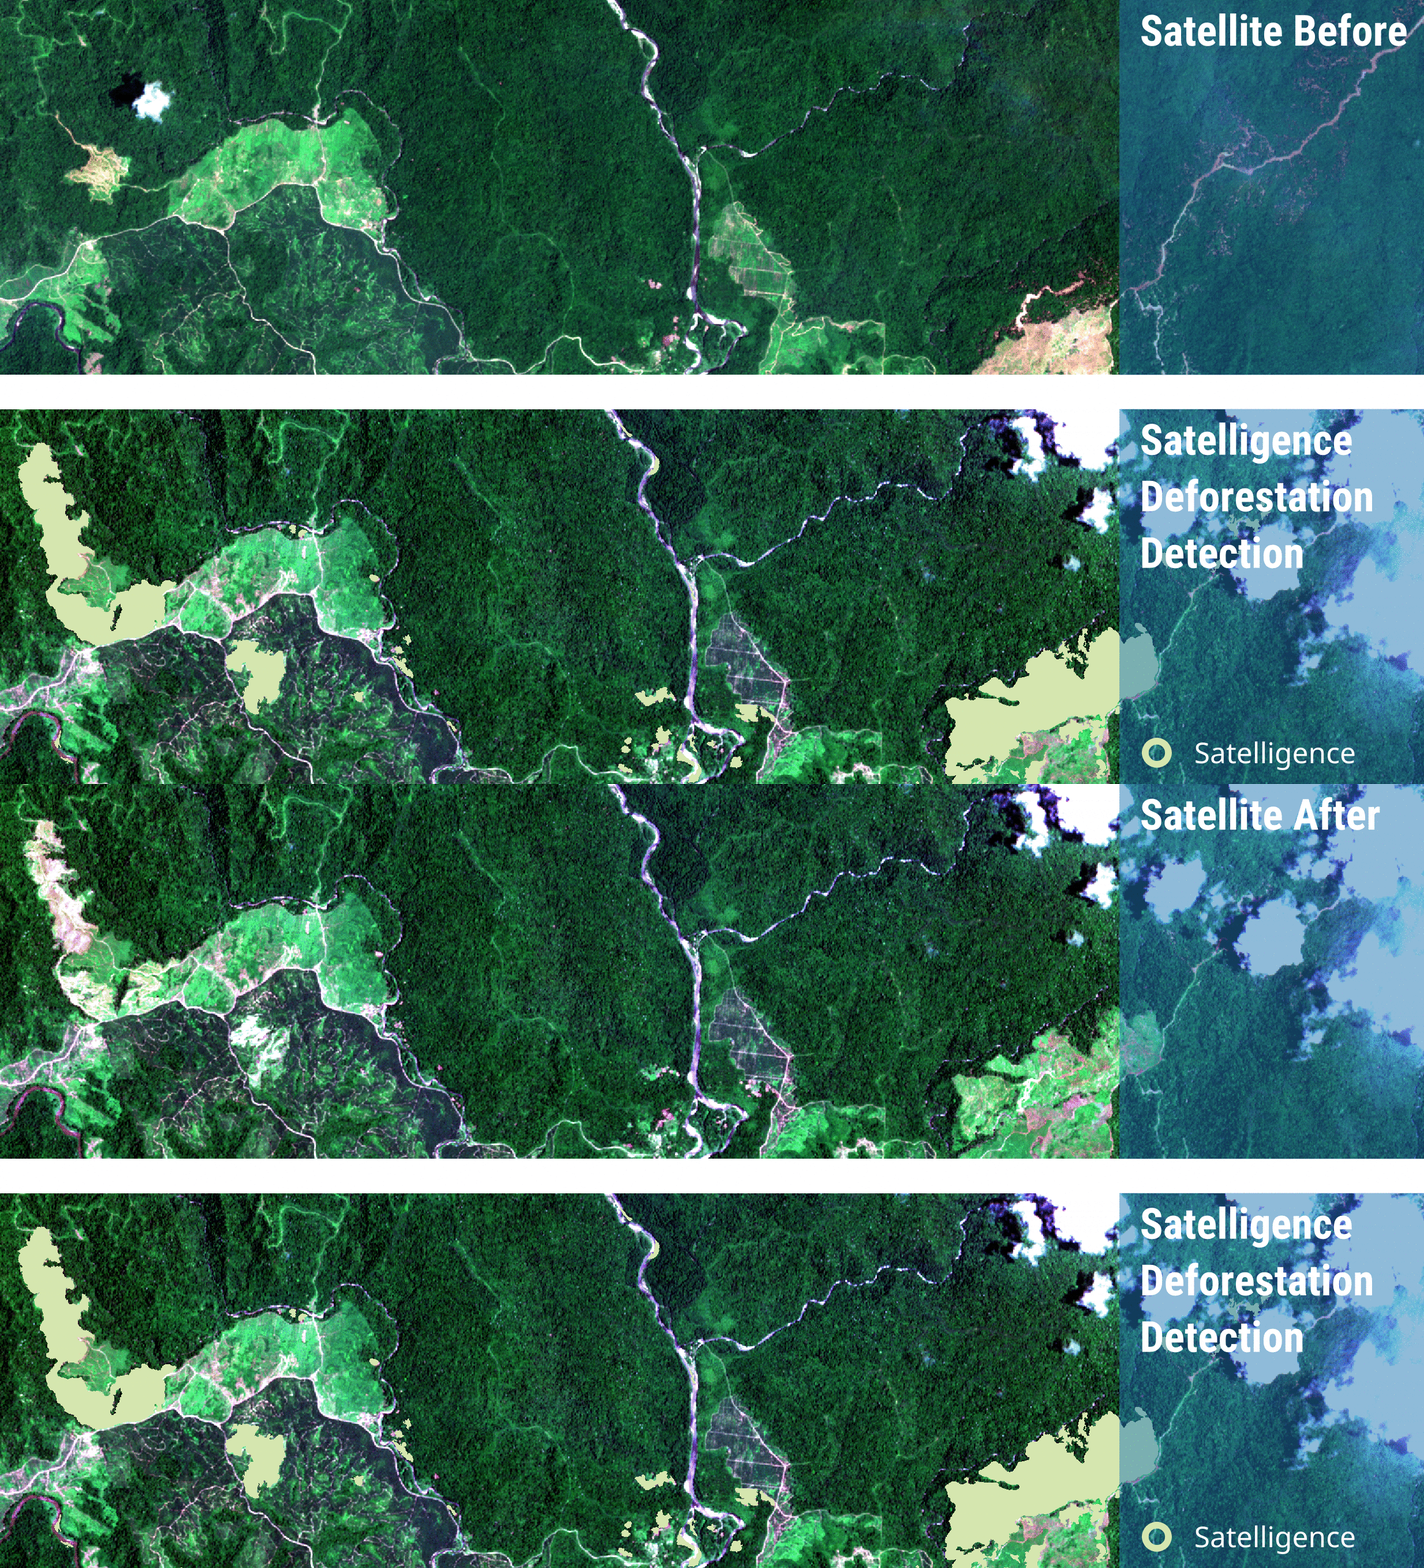
For every pixel in each polygon, our system calculates if the algorithm output was correct. From this collection of ‘right’ and ‘wrong’ pixels, we derive an accuracy estimate. A couple of accuracy indicators are used, but it is easiest to explain the overall accuracy which is defined as the ratio between the number of correct predictions of (non-)deforestation and the total number of predictions.
The total deforestation detection accuracy in the Papua New Guinea example is 92.3%. That means that out of a 1000 pixels, 923 are correctly classified as either deforestation or non-deforestation.
Comparing our deforestation detection to another system in Ghana
There are a number of other providers of near-real time tree cover loss detection systems. Most of these systems do not discriminate between tree cover loss and deforestation, which can make a world of difference if you want to use these alerts to take appropriate action. Satelligence does make this distinction. That is why our deforestation detection system results in actionable insights instead of general information on blanket deforestation.
We chose Ghana as a case to compare the different systems because it is a notoriously difficult area to detect deforestation. There is almost persistent cloud cover throughout the year, a lot of atmospheric haze, and the deforested areas are relatively small compared to the large-scale deforestation that is ongoing in Southeast Asia and Central and South America.
The Satelligence deforestation detection system got an accuracy of 83%, which is, we believe, considering the difficulties in the area, a very good result. Currently, we are in the process of tuning the algorithm to further improve for this type of area. We are aiming to get the accuracy up to at least 95%, to match our system’s performance in other countries.
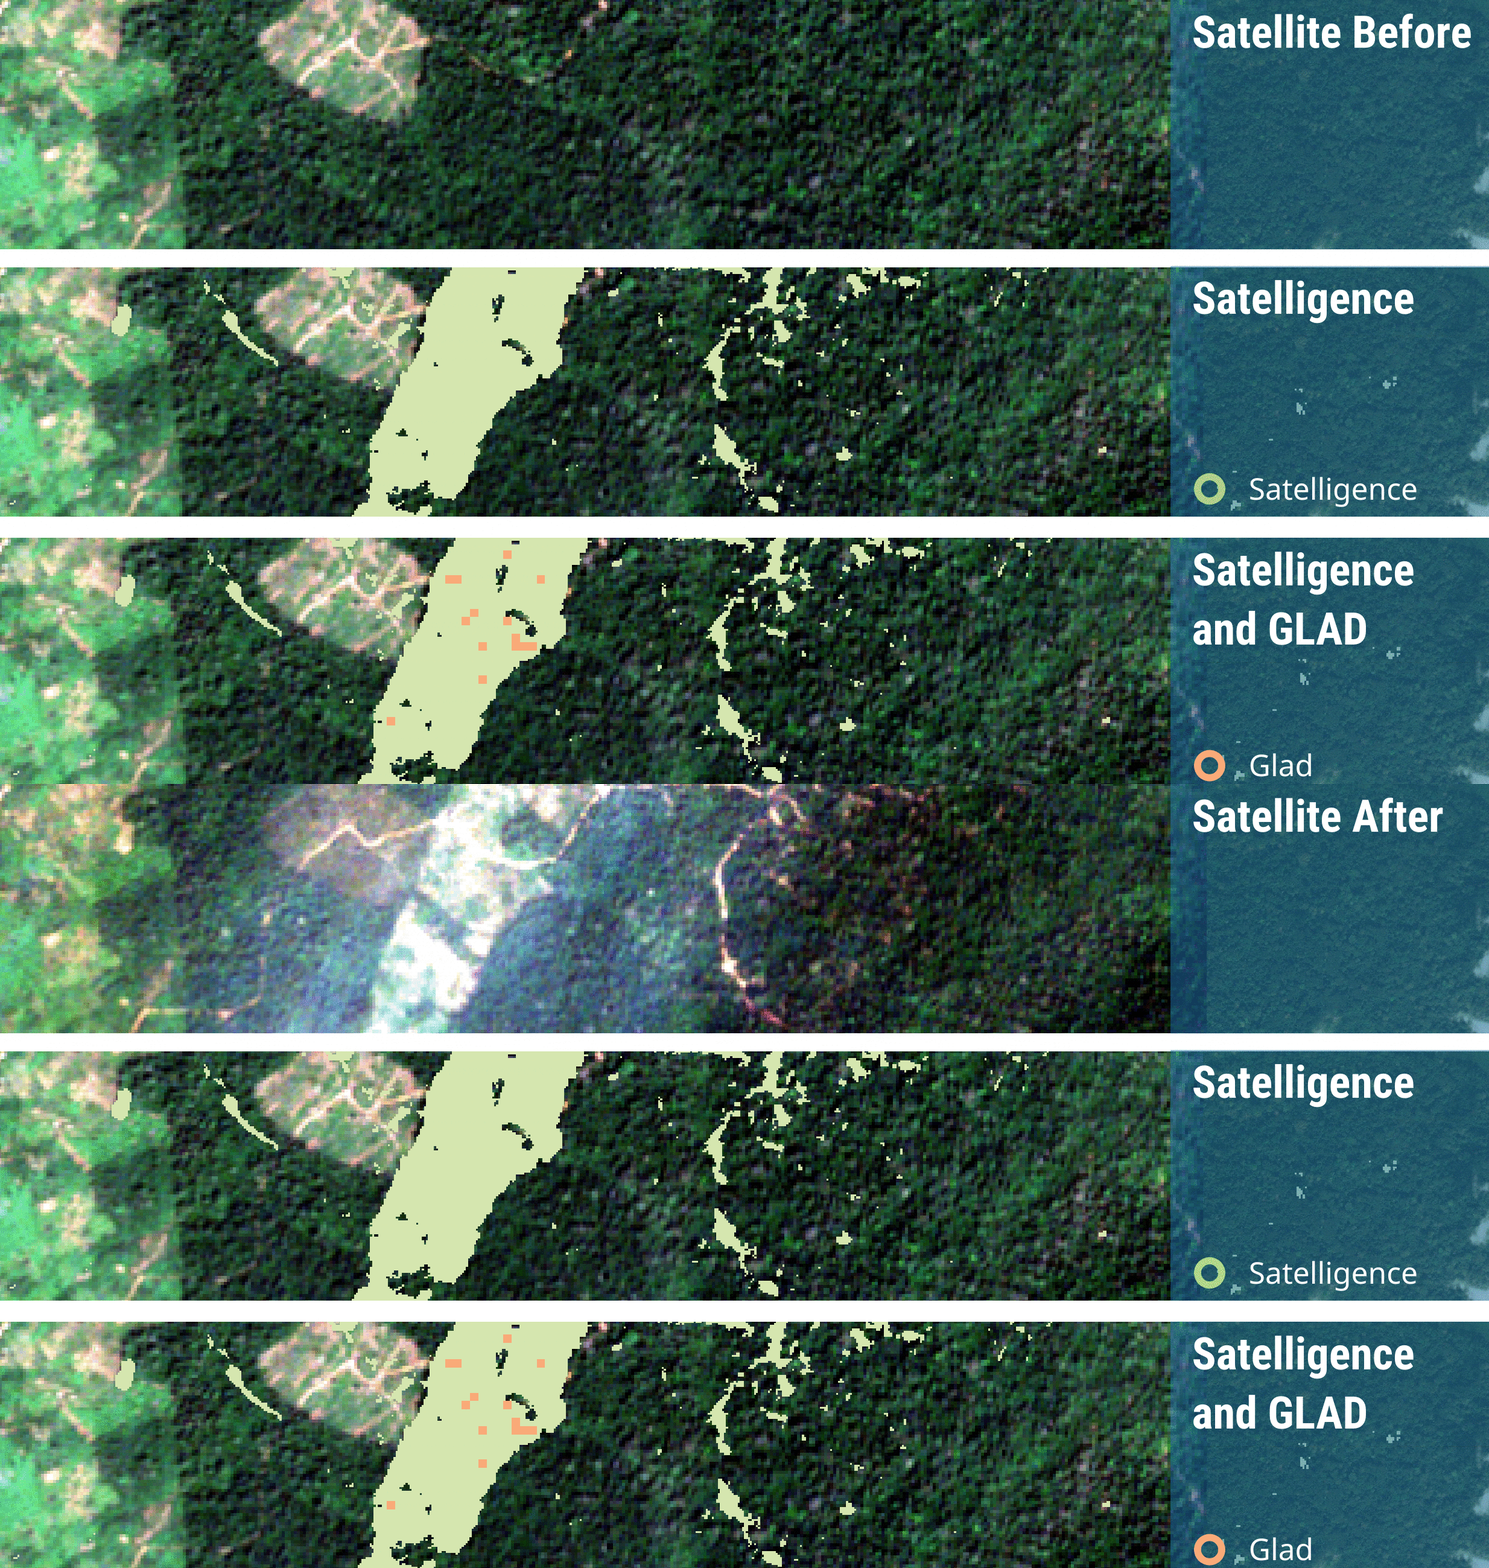
Comparing our accuracy to GLAD
We also assessed the accuracy for the GLAD system that is available through Global Forest Watch1. This near-real time system uses the (optical) Landsat satellite constellation, and was developed for Indonesia, Malaysia, Peru and the Democratic Republic of Congo2. We could not compare to other (commercial) systems here, because the data they provide are not open.
Using the same reference dataset we found that the accuracy of the GLAD system in Ghana was 45%. Notably lower than Satelligence. We believe the much higher accuracy in our system is caused by the incorporation of radar data, which makes it possible to look through clouds.
When you look at the image below, you can immediately see the large difference between Satelligence and GLAD systems. Where we pick up all the changes that occur within the area, GLAD only manages to find a few pixels, which account for only a fraction of the area actually cleared.
Checking deforestation detection timeliness in Brazil
Deforestation is happening continuously. So when it happens, you want action to be taken as quickly as possible. This means that we also have to check the time it takes before our system actually detects an alert after it actually happened, and how this compares to other systems. Our reference dataset includes the closest deforestation date we could establish. Knowing this date, we can cross-reference the deforestation alert derived from our detection system to see how much time it takes before a deforestation event is actually detected. The same is done for results from other providers available in Brazil, to compare timeliness between systems.
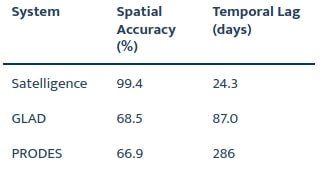
Below you see an example area in Brazil, where we have tested the spatial accuracy and the mean difference between the dates in the reference dataset, the deforestation detection services of Satelligence, GLAD and PRODES2.
We can clearly see in the images that both Satelligence and PRODES detect a lot more deforestation than GLAD here. This is also reflected in the accuracy figures in the table below, where Satelligence reaches an accuracy of 99.4%, while PRODES and GLAD only achieve 66.9% and 68.5%, respectively.
If we look at the timeliness, we see that there are large differences in the detection of the deforestation pixels. Satelligence has an average lag of 24.3 days in this area, while for GLAD the delay goes up to 87 days and even to 286 days for PRODES. One such large delay occurs for the deforestation patch in the west of the image below. Reference data indicates this area was deforested on October 10, 2018. Satelligence and GLAD record the deforestation on October 18, while PRODES only records it July 18 2019, i.e. 8 months after the actual event.
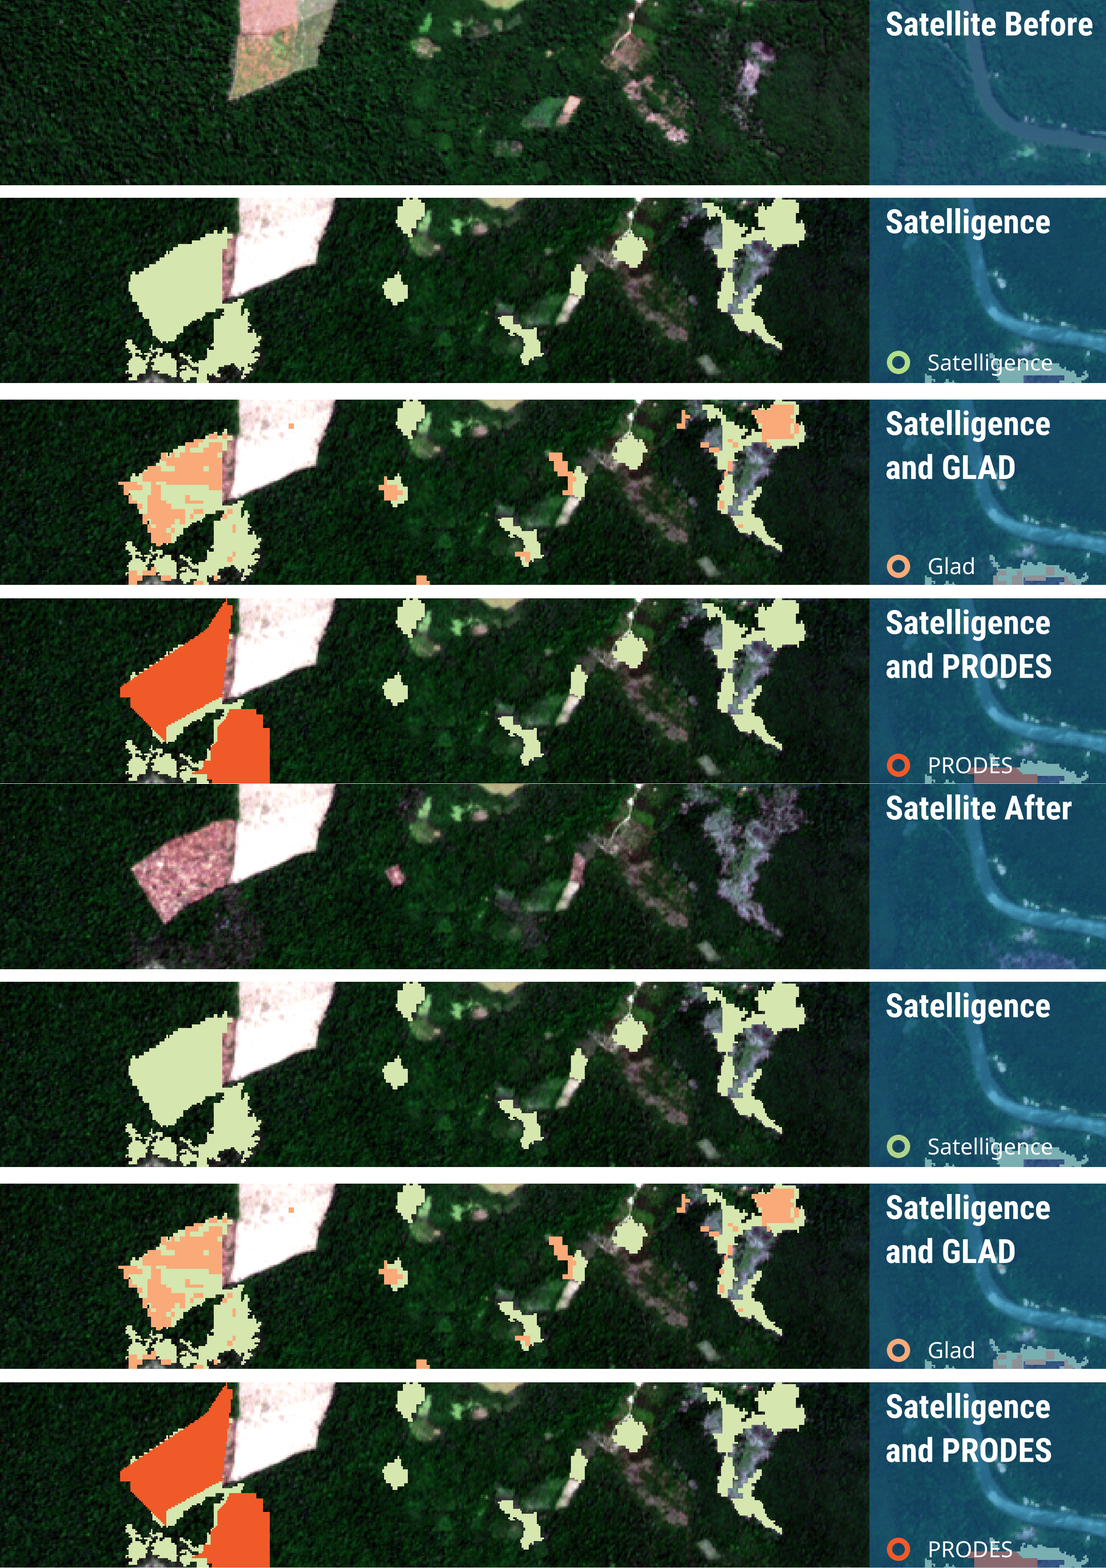
Before and after satellite images of an area in Brazil (1st), near-real time deforestation detected by Satelligence in green (2nd), by Satelligence in green and GLAD in orange (3rd) and by Satelligence in green and PRODES in red (4th). Note the large patches of deforestation that both GLAD and PRODES are missing
And although it seems as though the Satelligence system still takes quite some time in detecting deforestation (24.3 days), this lag is in reality much smaller. This is because our reference dataset is also based on optical satellites. So when there is extensive cloud cover it is hard to determine the actual deforestation date. This means that the date we have put into our reference dataset can be up to a few weeks early, making it seem like the detection has a long lag.
Open data FTW
Summarizing, we believe open satellite data is the best source to monitor deforestation. The 3 cases above describe how we always test our system to make sure our results are reliable. Because we provide a service with short revisit times and radar technology we can determine very accurately where and when deforestation is happening. Even when it is cloudy. And we don’t need expensive satellite data. All our data is based on freely available data – independent and guaranteed for at least the next 10 years.
“We believe open satellite data is the best source to monitor deforestation”
Aim for reliable deforestation alerts and we are sure you can have constructive calls with your suppliers. And if he or she really wants more deforestation information, you can always give us a call. Our system allows you to add on additional requirements at any time.
Our next blog goes into more detail for deforestation detection in West Africa. Not only about how deforestation is detected, but also to link deforestation to the deforestation drivers.
If you want to read more check out our other blogs about satellite technology on our website.
References
Global Forest Watch GLAD Alerts (https://glad-forest-alert.appspot.com/)
TerraBrasilis (PRODES) (http://terrabrasilis.dpi.inpe.br/)
