Scope 3 emissions
As the climate emergency intensifies and its effects become increasingly tangible across the world, a shift towards sustainable development and a circular economy is necessary. Within this context, companies worldwide are required to calculate the greenhouse gas (GHG) emissions connected to their supply chains, target a net-zero horizon, and reduce emissions accordingly.
However, estimating emissions is a difficult task. In order to accurately quantify them, emissions are divided into three categories, or scopes. Scope 1 and 2 encompass a company’s direct and indirect emissions, such as fuel combustion and electricity or heating usage. Scope 3 includes emissions generated by activities not controlled (and potentially not even known) by the given company and typically represent the lion share, up to ~95% of the total for Mondelez in 2021. To complicate things further, scope 3 emissions can be both upstream and downstream of the company. For example, emissions resulting from the production of raw materials that a company buys to generate its product are considered upstream, while the ones related to the disposal of a product when it reaches the end of its life are considered downstream.

Scope 3 emissions constitute the majority of the total GHG emissions of a company.
Source: GHG Protocol scope 3 report, page 5
At Satelligence, we are committed to a deforestation-free world. We help companies in agricultural commodity supply chains to achieve sustainable practices by understanding the deforestation and emission risks in their supply chains.
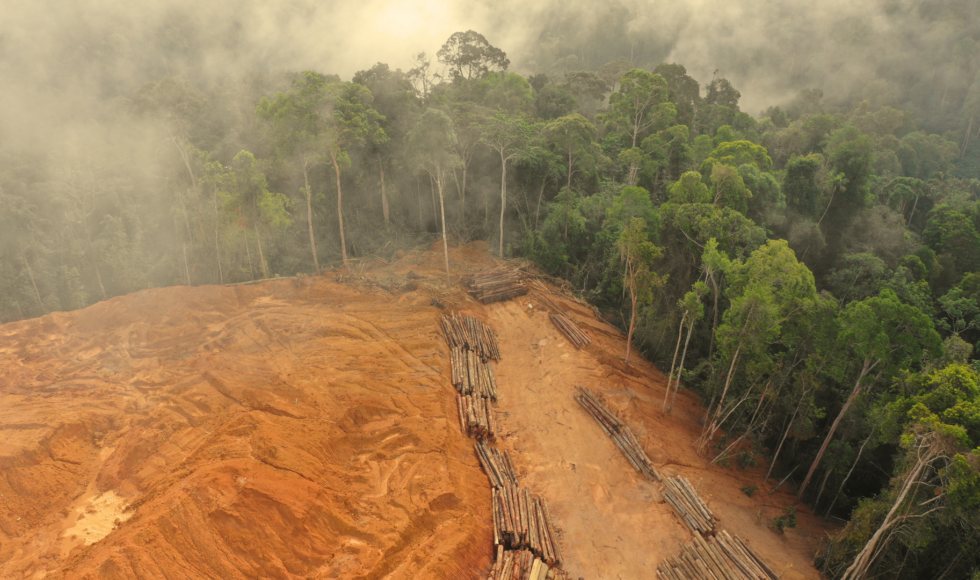
When working with commodities such as palm oil, cocoa, or soy, emissions related to land use change — mainly clear-cutting of primary forest to plant commodity trees — represent the largest contribution of a company’s emissions. The Hershey Company, a global giant in chocolate manufacturing, reports that land-use change emissions account for an estimated 42% of their scope 3 emissions and 38% of their total GHG emissions.

When reporting on their scope 3 share, many companies such as Lindt have had to rely on country- or industry-based GHG emission factors, which represent an average and are not necessarily related to any specific company activity. Additionally, or alternatively, some companies have quantified emissions related to land use change by overlaying their sourcing areas with publicly available tree cover and forest change maps; this allows carbon emissions to be calculated from a baseline year, typically 20 years back in time. However, this method is problematic since it uses tree cover instead of forest cover, thus grossly overestimating historical deforestation rates.
Up-to-date and accessible forest baseline definition and commodity production area data are critical in order to consistently monitor and quantify emissions related to land use change on a yearly basis at high spatial resolution.
GEDI – Measuring forest carbon stocks from space
In 2018, a one-in-a-kind instrument was installed on the International Space Station: GEDI (Global Ecosystems Dynamics Investigation). A joint mission between NASA and the University of Maryland, GEDI is the first spaceborne lidar sensor to be deployed specifically for forest monitoring (Dubayah et al., 2020). Three infrared lasers measure the 3D structure of the Earth’s forests between 51.6 degrees north and south by sampling forest canopy height and its vertical structure within 25 m ground footprints.

GEDI data can be fed into mathematical models called “allometric equations” which relate forest height and structure to its carbon content. Several allometric equations exist, depending on the forest type and geography, and the GEDI Team compiled a list of equations that have been calibrated with local field data and airborne laser scanning data (Duncanson et al., 2022). Land classification maps are then queried to know if a given observation was acquired over forest and, if so, over which type. At Satelligence, we use our own map at 10 m spatial resolution, which not only distinguishes between different forest types but also includes commodity crops such as palm trees.
While the GEDI instrument delivers tens of thousands of high quality canopy observations every day at global scale, it is a sampling mission that does not acquire data on a uniform grid. However, when GEDI data and data from high-resolution satellites such as Landsat, Sentinel-1, and Sentinel-2 are fed into a machine learning model, a wall-to-wall map of carbon density at fine spatial resolution can be created. We generate such maps at seasonal or yearly temporal intervals depending on clouds over the region of interest. This dataset then serves as the basis for final carbon stock estimates. Thanks to the high resolution of GEDI data (25 m footprint) and its global coverage (between 51.6 degrees north and south), our models are highly detailed and cover vast areas. For example, over Sabah, Malaysia (74,000 km2), our 10 m carbon density model can clearly distinguish different fields and even resolve 40m-wide dirt roads between rows of palm oil trees.
