

Confident Deforestation- and Conversion-Free (DCF) commitments don’t require perfect traceability: companies can use structured pathways to assess risk and build evidence progressively as their data improves.
DCF traceability pathways are structured routes that translate the supply chain data you have today (whether that’s “no plot data available” to full polygon-level traceability) into consistent, defensible assessments of whether your sourcing is deforestation- and conversion-free. These pathways allow you to act now, whilst strengthening evidence and confidence over time.
Even with rising regulatory pressure, very few companies enjoy uniform, high-quality traceability across their entire portfolio. The EU alone was exposed to around 112,500 hectares of imported deforestation per year between 2021 and 2023, according to Trase. That exposure is spread across multiple commodities, suppliers, and jurisdictions where data quality varies widely.
This uneven reality is precisely what the Consumer Goods Forum’s Forest Positive Coalition designed its DCF pathways (A-E) to address.
Through its comprehensive DCF Methodology document, Satelligence builds on that shared language and translates it into a geospatial implementation that can be applied across a broad range of commodities, from palm oil and cocoa to soy, coffee, rubber, and more. The aim is to provide sourcing and sustainability teams with a practical route from “some data” to decision-ready insight.
By aligning internal DCF strategy with these pathways, companies avoid ad-hoc interpretations of risk and can explain, in clear terms, how each volume was assessed, which evidence was used, and what level of confidence sits behind any claim made.
How the DCF decision flow matches your traceability reality
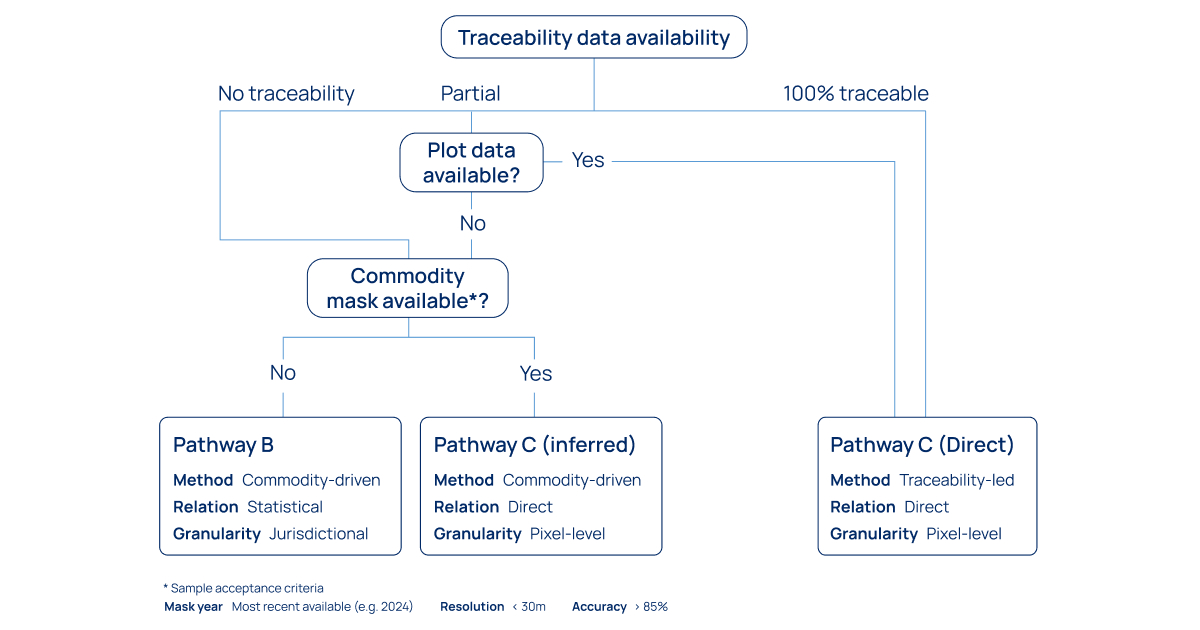
At the heart of Satelligence’s approach is a key question: how far upstream can you reliably see today? The traceability pathways framework takes that starting point and routes each sourcing area through the most appropriate method , without waiting for “perfect” data.
The decision logic starts with your traceability tier. If you have no supplier-level or facility-level traceability for a given flow, the methodology treats this differently from a mill where you can already supply plot polygons. Where traceability is partial, the decision flow asks whether credible commodity maps are available for the geography in question, and whether they meet defined quality thresholds on resolution and accuracy.
For example, if you can provide geolocated plots for part of your cocoa supply chain, but only broad sourcing regions for the rest, those segments will follow different pathways. One will benefit from pixel-level analysis linked to exact plots; the other will rely on carefully selected proxies that still distinguish between negligible and non-negligible risk. Both are grounded in the same DCF logic, but the evidence tiers and confidence levels differ and are therefore reported differently.
This is what turns an abstract flowchart into a business tool: each branch reflects a realistic traceability scenario your teams already recognise, rather than forcing a binary “compliant or not” judgement detached from data quality.
Inside the traceability pathway C: from pixels to plots
When you do have strong upstream traceability, Satelligence can treat that data as the backbone of a traceability-led pathway, corresponding to the Coalition’s Pathway C. Here, plot polygons or other precise production boundaries become the frame into which all other geospatial information is fitted.
Satelligence overlays those boundaries with ecosystem baselines and detected deforestation and conversion (D&C) events at pixel level. This allows DCF performance to be calculated for a specific plot, aggregated up to a facility, supplier, or portfolio view. The same methodology supports multiple cut-off dates, so your EUDR-aligned checks can run alongside voluntary NDPE or SBTi FLAG commitments without duplicating work.
In practice, this means your teams can move from generic “country risk scores” to concrete answers to questions like: which exact farms, supplying which mills, contributed to our low-risk palm oil or cocoa volumes last quarter?
The strategic value of traceability pathways
Of course, not every sourcing region is ready for plot-level analysis. That is where the defined-area, risk-screening logic – aligned with Pathway B – becomes a critical stepping stone rather than a second-best compromise. Here, robust crop-distribution proxies and other spatial datasets are used to identify likely production areas, flag higher-risk sourcing bases, and prioritise where you need deeper traceability.
Satelligence’s defined-area approach follows the principle that every pixel is accounted for using the best-quality data available, and low-risk areas are clearly distinguished from those that require further investigation or supplier engagement.
The strategic value lies in how you use these tiers. Pathway B provides a defensible view of where risk is concentrated, supporting sourcing decisions, supplier prioritisation and investment in better data. Where stronger traceability or suitable commodity-specific spatial data is available, Pathway C can support more granular, production-area-level DCF assessments. Together, the pathways provide a flexible framework for matching the assessment method to the traceability and data available for each sourcing flow.
For companies under pressure to demonstrate DCF performance across complex, multi-commodity portfolios, this approach recognises that traceability will not be uniform. Instead, it provides a structured way to assess different sourcing situations using the best available evidence, while making differences in methodology, evidence and confidence transparent.
Key takeaways
Traceability pathways turn imperfect supply chain data into actionable DCF decisions. Companies can begin assessing their sourcing using the best evidence available, rather than waiting for complete plot-level traceability.
Different levels of traceability require different assessment methods. From broad sourcing regions to precise farm polygons, each volume can follow an appropriate pathway while maintaining consistent DCF logic.
A pathway-based approach allows companies to clearly explain how volumes were assessed, what evidence was used, and the level of confidence behind DCF claims.
The pathways can also present a roadmap for continuous improvement. Companies can progressively move volumes from risk-based screening towards precise, production-area-level assessments as traceability improves.