
The most useful deforestation risk tools for palm oil and cocoa combine four elements: high‑accuracy forest and commodity baselines, geospatial screening that checks supplier polygons and points, portfolio dashboards that summarise risk, and workflow tools that link evidence, risk scores and EUDR due diligence decisions.
For companies in the palm oil and cocoa sector preparing for EUDR implementation on 30th December, their procurement, sustainability, or compliance teams need nature and commodity baselines capable of distinguishing natural forest from plantation cocoa or oil palm in complex smallholder landscapes.
Most operators use a stack of solutions that together can:
- Map forest, non‑forest, and commodity crops over time at plot level
- Intersect supplier polygons and points with those baselines
- Aggregate risk patterns across suppliers, countries, and entities
- Document how each risk is investigated and resolved for auditors
Key tool types for EUDR-ready palm oil and cocoa supply chains
- Forest, nature and commodity baselines
A nature and commodity baseline translates satellite imagery into land‑cover and commodity classes over multiple years. For palm oil and cocoa, this baseline must:
- Distinguish natural forest from commodity growth such as cocoa, coffee, and oil palm
- Provide coverage for all sourcing regions at suitable resolution
- Include years around the EUDR cut‑off date of 31 December 2020
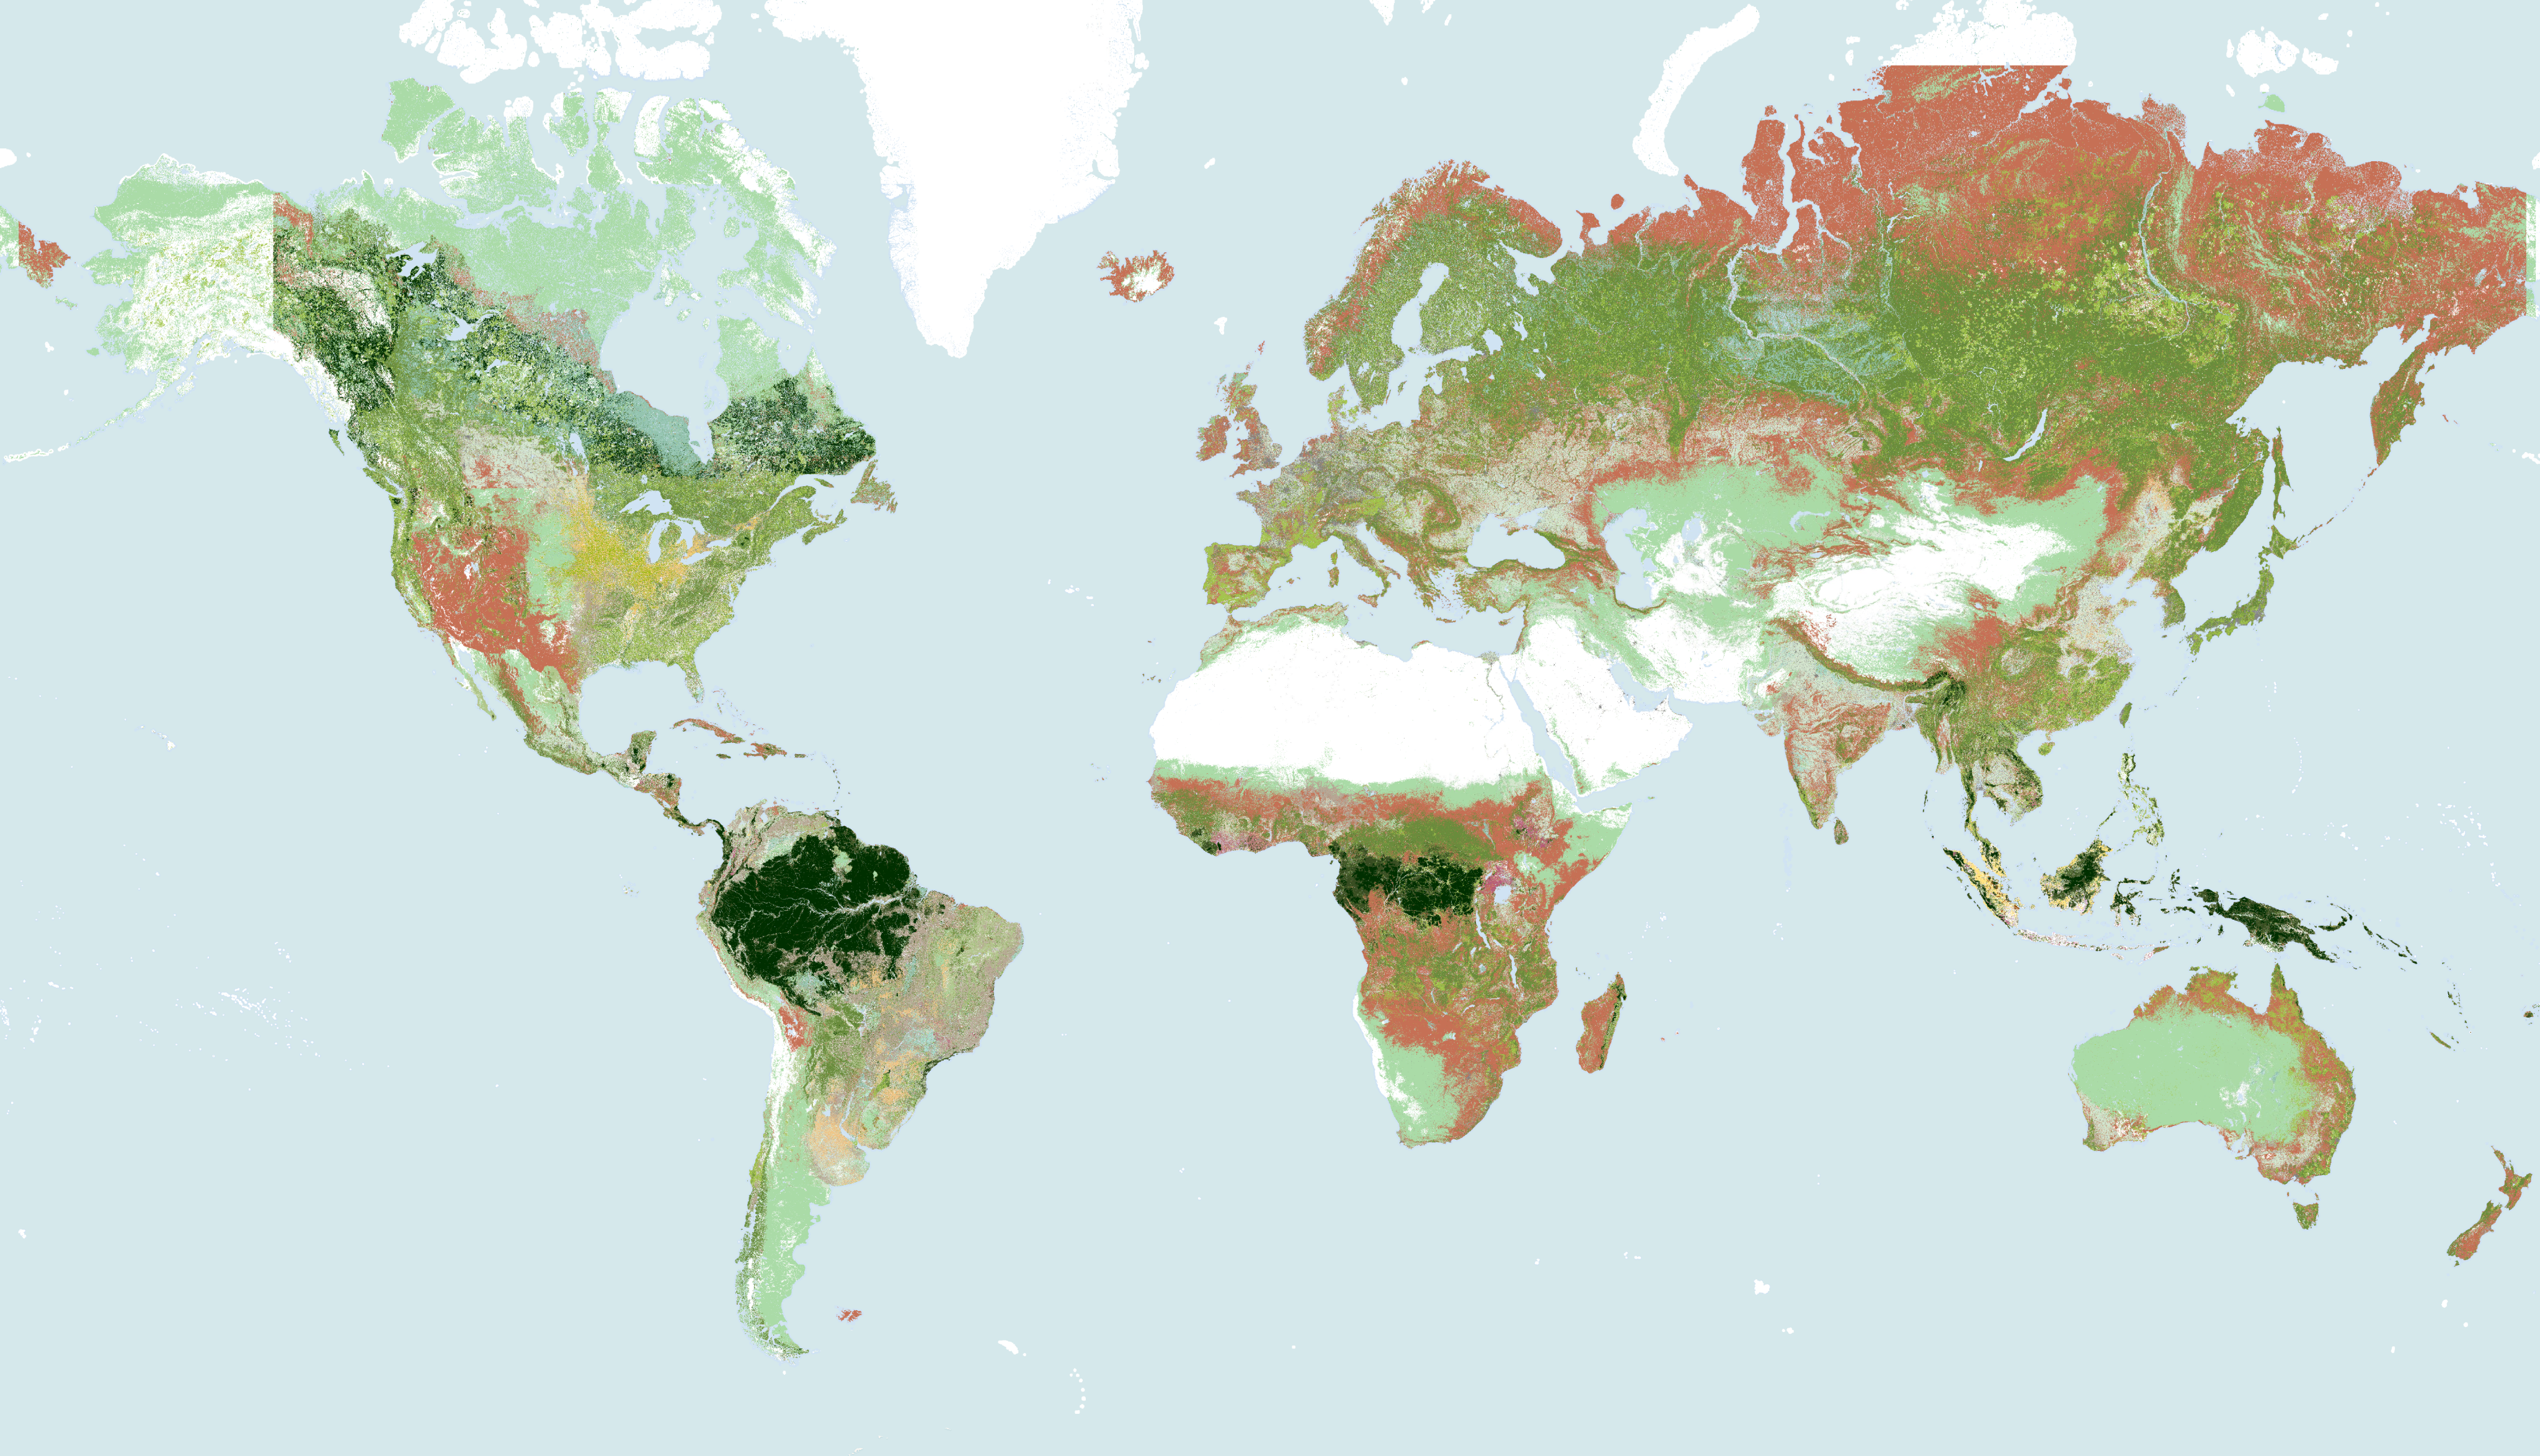
Satelligence’s Baseline Layer, which underpins ourbroader Harmonised Nature & Commodity Baseline (HNCB), has been assessed for overall accuracy (forest vs non‑forest) at 10‑metre resolution in several regions.
An independent report carried out by CIAT and the World Cocoa Foundation reports 87% precision for Satelligence’s forest classification in Côte d’Ivoire, the highest among the evaluated datasets.
Country‑level results illustrate why the choice of baseline matters for cocoa and palm oil:
In Côte d’Ivoire, Satelligence’s forest baseline achieved 93.3% overall accuracy, compared with 77.1% for the JRC EUDR v2 layer and 77.5% for the national land‑cover map, all validated against the same reference labels.
Overall accuracy and precision measure different aspects of performance and come from separate studies, so these figures should not be treated as interchangeable or as results from a single assessment. For palm oil and cocoa operators, they do show that baselines can perform very differently in the same landscape—especially where perennial crops and natural forest grow side by side.
Satelligence combines its forest baseline with commodity maps for cocoa, coffee, palm oil and other crops, curated open datasets and on‑the‑ground validation so that our Harmonised Nature & Commodity Baseline can better separate production areas from natural ecosystems where the data supports that distinction. This kind of baseline becomes the evidential backbone for all other tools in a company’s overall sourcing approach.
- Geospatial screening and alerting tools
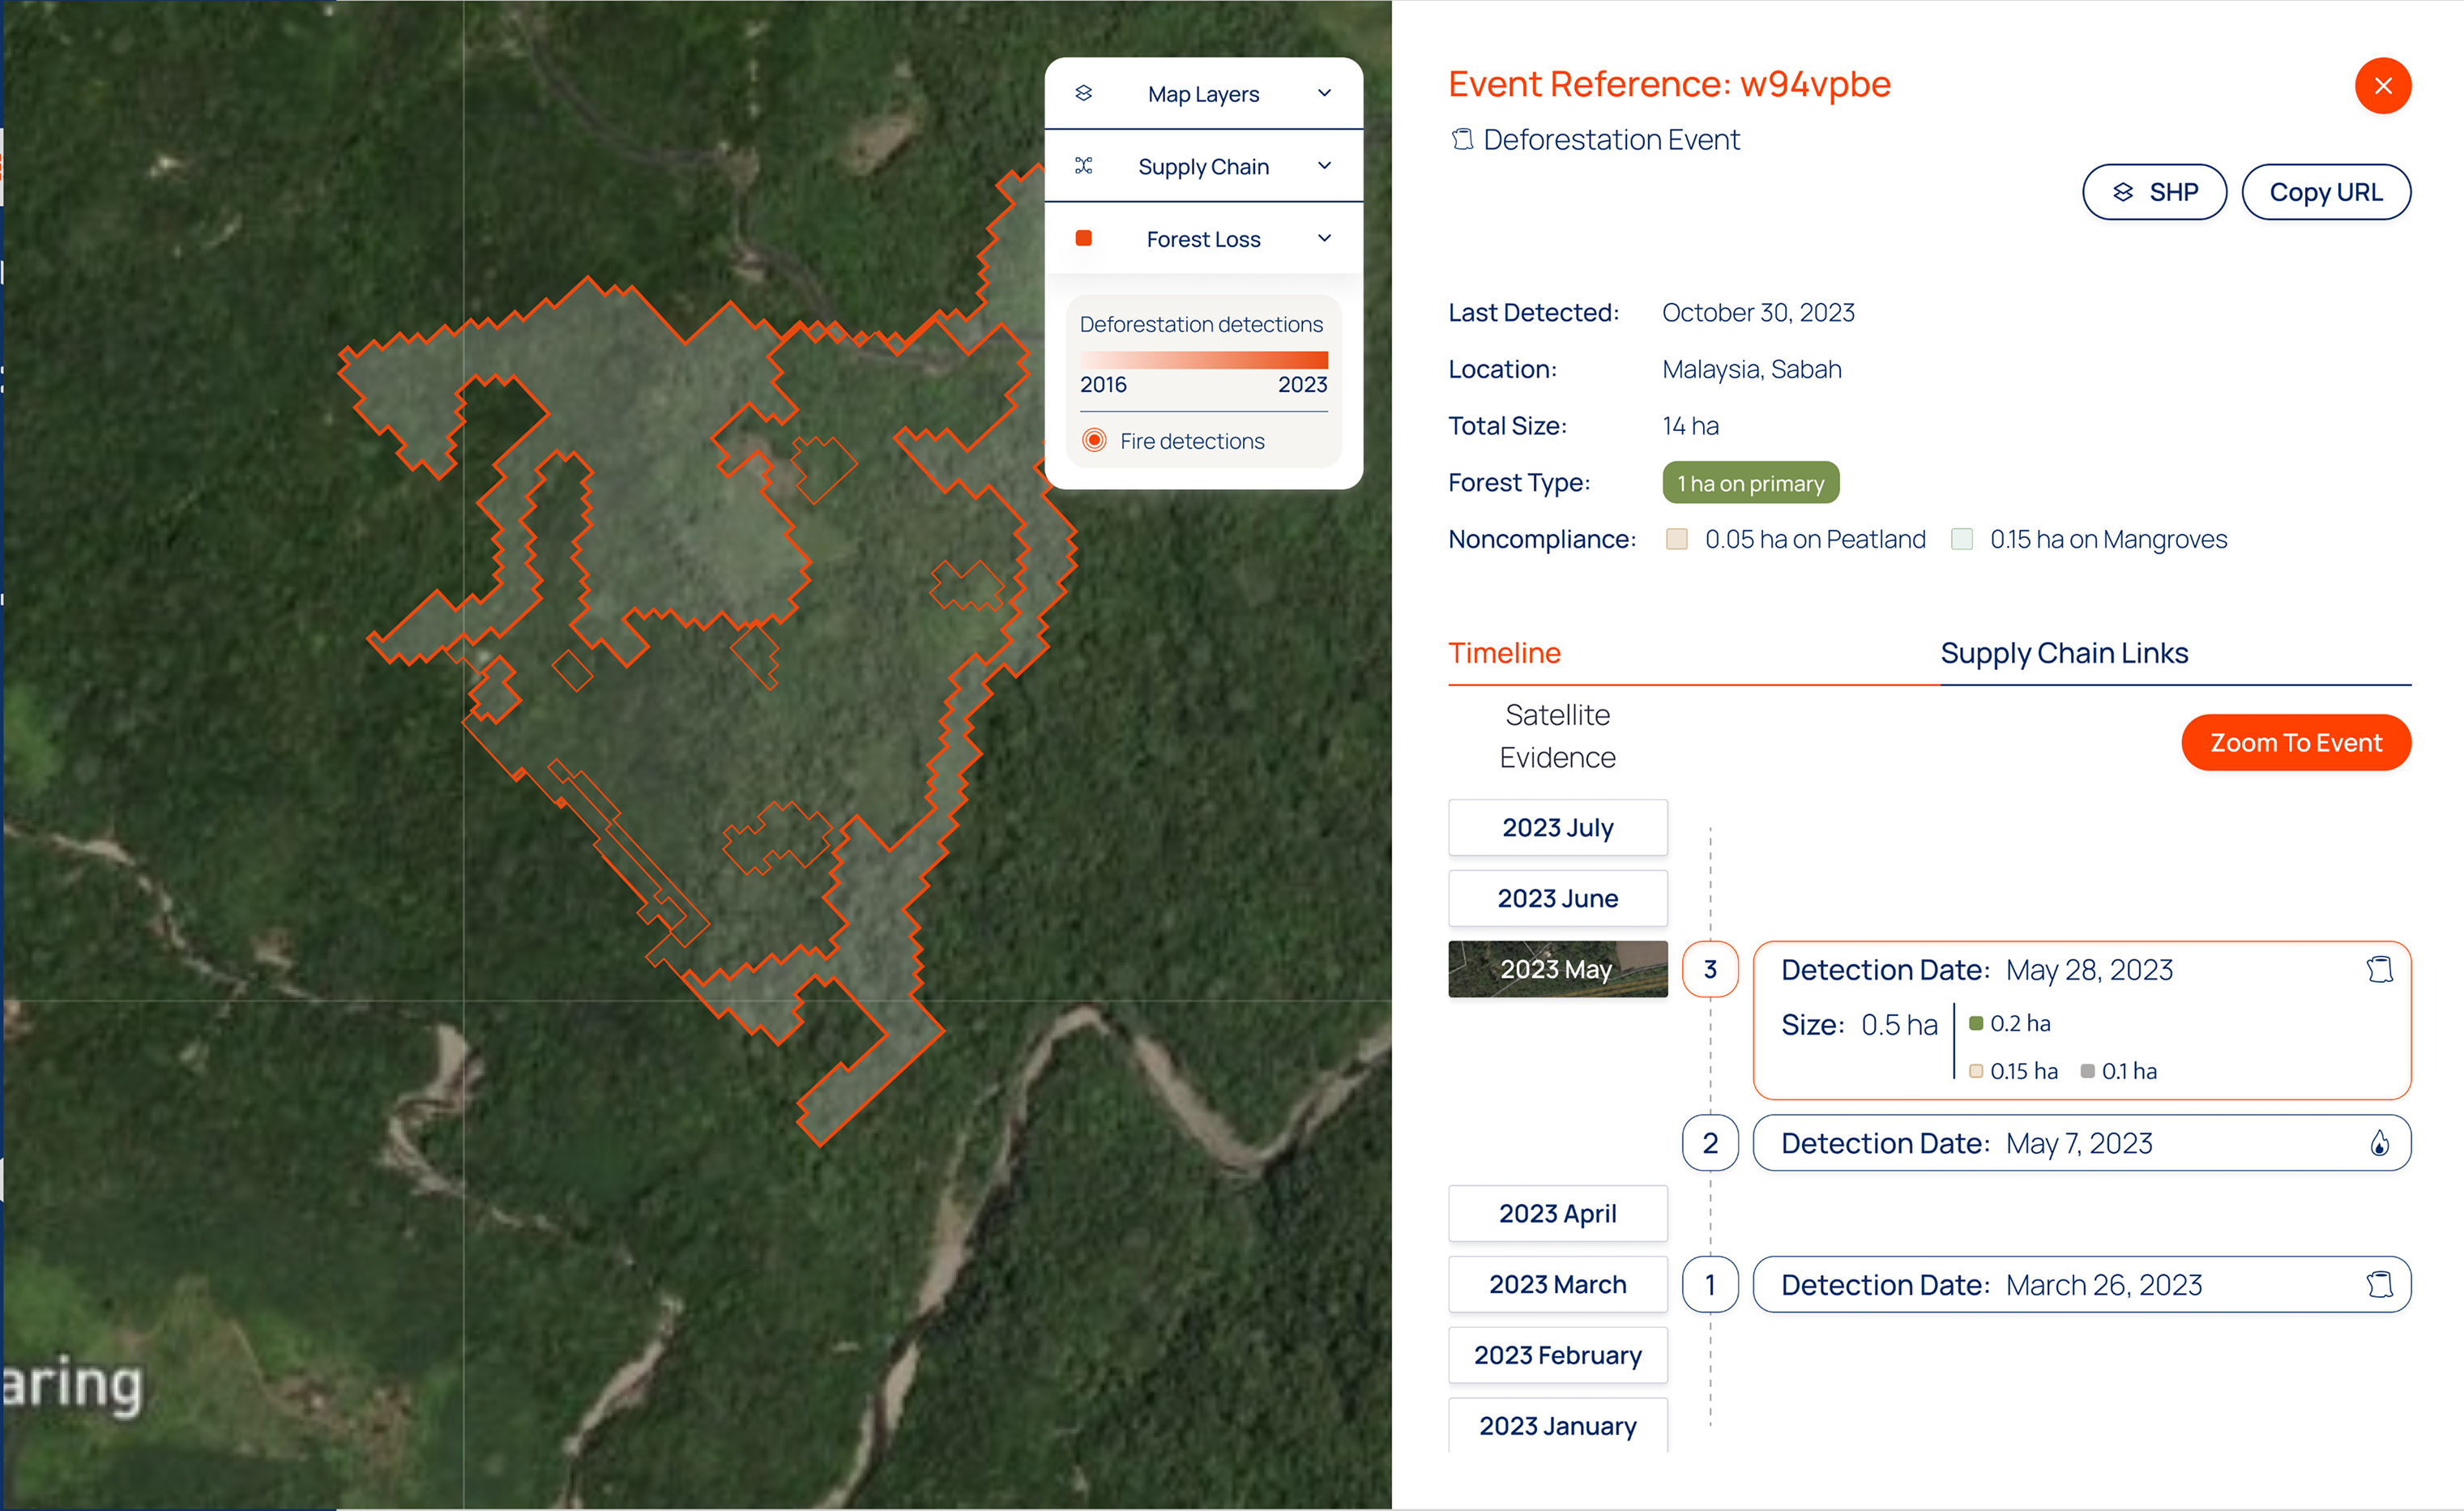
Geospatial screening tools intersect supplier geolocation data—polygons and point coordinates—with the baseline to flag potential deforestation or conversion around plots. For palm oil and cocoa, useful capabilities include:
- Handling large volumes of smallholder plots and estate polygons
- Visualising high‑resolution imagery to investigate alerts
- Distinguishing alerts affecting natural forest from those linked to replanting or agroforestry
Whichever tools a company chooses, the key is consistency: the same plots should be assessed against the same definitions and datasets across suppliers and over time. That is what auditors and national competent authorities (NCAs) will look for when they review how a company has translated data into conclusions about risk.
- Portfolio risk dashboards and workflow tools
CPOs, CFOs and risk teams need more than individual plot alerts. They need to see patterns—where risk concentrates, where data is missing, and how risk handling decisions are distributed across business units.
Portfolio dashboards summarise, for example:
- The share of palm oil and cocoa volumes exposed to high, medium or low deforestation risk
- Countries and suppliers that account for most medium/high‑risk plots
- Where geolocation or documentation gaps might undermine due diligence statements
Workflow and evidence‑management tools then record:
- Requests for additional information or improved polygons
- Field verification or engagement with producer groups
- Decisions not to source, or to continue sourcing with mitigation
Satelligence’s own EUDR solution combines our Nature & Commodity Baseline with supplier data collection, risk assessment, and case tracking, so that each flagged plot is linked to both geospatial evidence and an auditable decision trail. Whilst other providers offer similar case management features, the underlying baseline and data quality determine how robust those workflows will appear to auditors.
How to evaluate and combine tools for your own supply chain
Step 1: Clarify what it is that you need
For palm oil and cocoa, start by mapping your current and future EUDR obligations:
- Which supply chains, countries, and volumes will require due diligence statements?
- How many plots and suppliers are involved, and how is geolocation data currently stored?
- Which teams (sustainability, procurement, legal) must use or review deforestation risk outputs?
This scoping exercise will quickly show where you need better plot level traceability, improved baselines, or stronger workflows.
Step 2: Assess baseline reliability and fit
Use a structured checklist when evaluating baselines:
- Accuracy and validation: Look for published accuracy metrics (for example, Satelligence’s 81–93% range across assessed regions) and, where available, independent benchmarking like the CIAT/WCF cocoa study
- Ability to separate forest from crops: Confirm that the dataset can distinguish natural forest from cocoa and oil palm in your sourcing landscapes, ideally using dedicated commodity layers
- Coverage and history: Ensure coverage for all sourcing regions at a resolution compatible with your polygons, and confirm that time‑series data spans the EUDR cut‑off
- Transparency: Check that methods, input datasets, and limitations are described clearly enough to share with auditors andNCAs. A nature and commodity baseline that scores well on these points will strengthen any screening, dashboard or workflow tool you connect to it.
Step 3: Test geospatial tools, dashboards and workflows together
Once you have shortlisted a baseline and one or more platforms:
- Run a pilot on a realistic subset of your palm oil and cocoa supply base.
- Check how easily supplier polygons and points can be cleaned, uploaded and maintained.
- Compare alerts and risk classifications with known cases of forest loss and non‑forest expansion.
Review whether workflows capture the information you need for EUDR due diligence statements—geolocation, land‑cover evidence, decisions and follow‑up actions. The goal is not to eliminate every grey area, but to show that you apply a consistent standard of evidence across suppliers and lots.
It all starts with the right foundation
A credible, well‑validated nature and commodity baseline is the foundation of deforestation risk tools for palm oil and cocoa. Combined with robust geospatial screening, portfolio dashboards, and workflow systems, it enables sustainability, procurement, and compliance teams to investigate potential deforestation, explain sourcing decisions and defend EUDR‑aligned due diligence.